This project ended on 29 October 2026 and is archived. Its pages show the state at its end. The final report
AI agents play CS2, a city-building and economic simulation, through a purpose-built MCP Model Context Protocol, an open protocol through which an AI model calls tools and reads data from other software. interface. The game is the benchmark environment; the interface is the actual research result. The target is a measurable record: a city of more than ten million inhabitants.
Long-horizon planning inside a simulation the agents did not write
Coupling agents to third-party software through the Model Context Protocol
Progress will be published with save games and logs, not screenshots alone
What the city measures
Every figure below comes from the game itself, read back through the interface and delivered as a daily data file: 2,568 measurements between 09/09 17:22 UTC and 25/10 22:50 UTC. Nothing is interpolated; where nothing was measured, the chart shows a gap.
Residents, last measurement
2,389,999
Highest measured
2,542,635
Measurements
2,568
Days covered
47
Named gaps
225
Of the ten-million target
23.9 %
Every measurement was taken under regular rules: no unlimited money, no building or map unlocks. The charts cover 47 days of the attempt so far.
One point per measurement, on a time axis, so uneven sampling stays visible. The points are not joined: where there are none, nothing was measured, and the reason is recorded with the delivery.
Difference between the first and the last measurement of each day, in UTC. A day with few measurements says less than a day with many; the count is under the bar, and in its tooltip where there is no room.
Unemployment as the game reports it, against the number of jobs in the city. Both were read back only in part of the measurements, so this chart is sparser than the one above.
Two of the game’s own indices, read back with the same measurements as the labour market.
Consumption divided by installed capacity, per utility. Only utilities for which a capacity was delivered are shown; the game reports these as plain game values without a physical unit, so the ratio is a measurement but the absolute numbers are not watts or litres. The time axis runs from the first to the last reading of the utilities, not over the whole series above; where nothing was read back in between, there are no points.
Delivered without an installed capacity, so there is no load to divide out: what is drawn is consumption against the production running at that moment. The distance between the two series of points is headroom at that moment, not a reserve the city has built.
Balance. The balance reached the 2bn mark in game funds on 12/09 11:38 UTC; since then it has stayed within 1.2bn below it.
Computing load
What the size of the city costs in computing time, from 63,467 readings of the game PC over 45 days. The game PC delivers counters and times about every 30 seconds; this site forms ten-minute windows from them by fixed rules and computes every rate itself. A window never spans a pause or a change of speed. Because the readings are half a minute apart, the moment of a change is not known: the interval it falls in counts toward neither speed, and a change back and forth between two readings can go unseen.
Each point is a ten-minute window at speed 4: process CPU per simulation frame, including rendering, the autosave (every five minutes) and building work. Filled: the city grew during the window; hollow: it shrank. Bars: median and middle half of each size class, from eight windows on. Where a reading carries no resident count, this site assigns one on a straight line between two readings of the day data at most an hour apart; that is a calculation of this site, not a measurement of the game PC. No extrapolation beyond the largest size measured.
Process CPU seconds per real second, which is the average number of busy logical cores. Not a reserve: the main thread and the dependencies between jobs bind long before all cores are busy.
Simulation frames per real second as a share of the nominal 60 per second and speed step, a figure given by the interface package reference and confirmed by measurements at speeds 1, 2 and 4. 100 percent means the simulation kept up, not that there is room to spare. The axis starts at 65 percent so that small shortfalls show.
Evidence for the nominal pace
Speed
Windows
Median frames per second
1×
1,495
55.7
4×
1,573
239.4
Covered: 45 days. 269.7 hours lie in drawn windows; the game PC declared 0.0 hours of gaps with a reason and 532.1 hours of gaps whose reason it cannot give; 0.0 hours are neither measured nor declared. Intervals below half the nominal pace: 13.
Periods with the same game version, interface version, performance setting and hardware are kept apart; nothing is averaged across them. ● environment unknown, from 14 Sept.
Not shown yet, because the game PC cannot yet deliver them with a settled meaning: area, public transport, and the work of the interface itself.
Series as of 2026-10-25, from 60 deliveries of the game PC. Every point carries its measuring time; the deliveries are listed with their SHA-256 A cryptographic hash. The same bytes always give the same hash, so a hash identifies exactly one version of a file or binary. in the series file.
City map
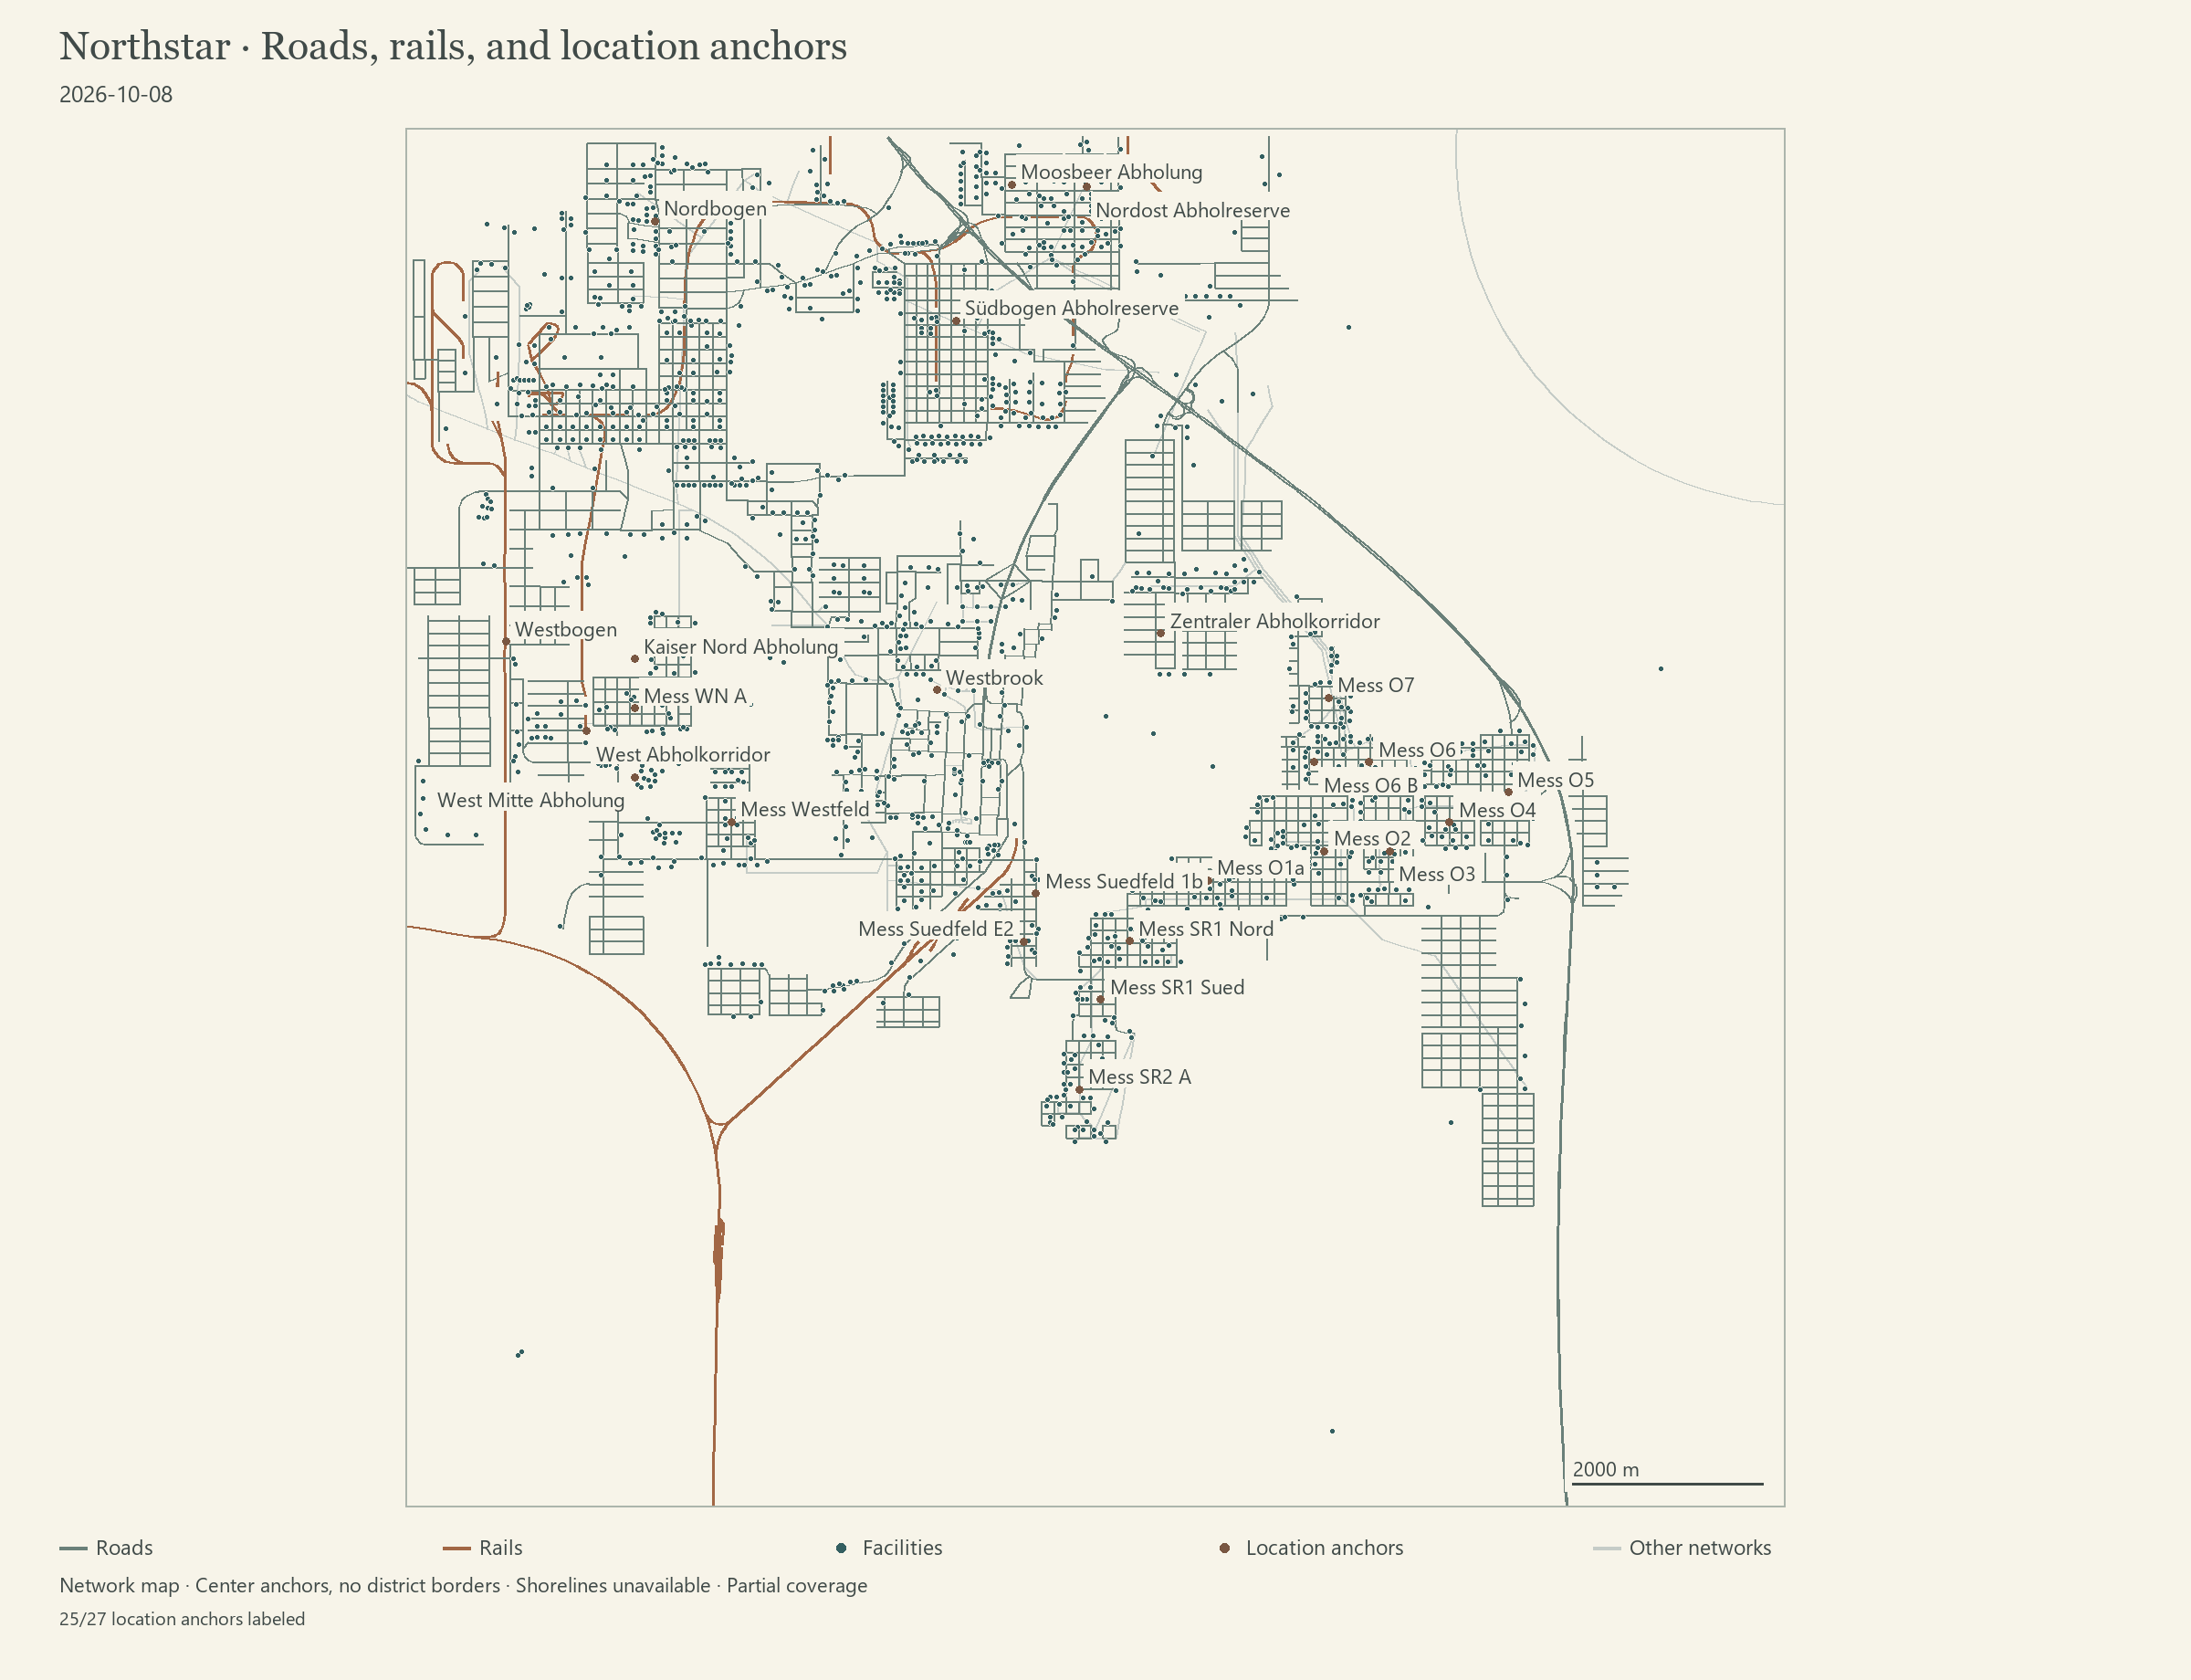
A map for finding the places the reports name: location anchors rather than area boundaries.
This map is 22 days old; what was built since is not in it.
Roads, rails and location anchors. Network map from the game's coordinates: roads, rails and facilities. The names stand at measured location anchors, not at district borders; two anchors are unlabelled. Shorelines, road widths and building outlines are missing, the capture is partial, and lines show no routes actually driven. Made on 8 October 2026; road and rail network of 8 October 2026.
What runs
The target counts simulated inhabitants; save games and logs are to let anyone load and check the state. The attempt started on 8 September 2026 on a PC prepared for long-running operation; a first city attempt was discarded, and the current series of measurements begins on 9 September 2026. A building agent observes the city, decides from the reported needs, builds roads and services, zones land and checks what actually appeared. Control ran at first through an open MCP project (Apache-2.0), extended where it fell short. It now runs through Northstar MCP, the research programme’s own interface.
Posts are written on commission: for a topic, the game PC delivers a report, usually with an attachment that carries the data for the charts. A reporter writes the post below from that report, in both languages, under the rule that nothing is written that the report does not say. The site draws the charts in a post itself, from the attachment or from the published series. Beside that, the building agent occasionally delivers a finished post with figures of its own and the series of measurements behind them. Such a post appears as it was delivered. The author line above every post says which of the two paths it took. The figures in the posts are the game's own readings at the stated time; no independent measuring instance checks them yet.
The game is a third-party product. Stackruns is not affiliated with its makers.
The Northstar experiment is over: the goal of ten million simulated residents was missed. The final state, the unresolved growth and speed problems, and the gaps left in data delivery.
Three feeder bus lines, five high schools and extra depot capacity are confirmed by read-backs. Population fell by about 104,000 between the first qualified snapshot and the last matching reading, and no speed improvement is shown.
On 27 October Northstar built five secondary schools, four college placements and four crematoria, removed 41 hearse garages and moved one college after a connection check. What the receipts show, and what they leave open.
On 26 October Northstar built three universities, a college and two extensions, and began rezoning southern industrial land to office use. What was built and counted, and what the figures do not yet show.
On 25 October Northstar worked on garbage collection in the existing city: two recycling plants and short roads. In a fixed group of 50 buildings the garbage warnings fell to zero. The metro change was reverted.