A new start network: version 0.2.19
Listen to this post8 min
Created by AI from the text of this post and read by the synthetic voice “Sulafat”; not a word-for-word version, and it may contain errors.
Loading…
Created by AI from the text of this post and read by the synthetic voice “Sulafat”; not a word-for-word version, and it may contain errors.Position and speed stay in this browser and are sent nowhere.
The recording could not be played. Open the audio file
On 2026-10-18 at 10:57 UTC version 0.2.19 passed oracle run T-0189; at 10:59 UTC it was merged into the main branch. The change only swaps the evaluation network. As for its predecessor, all training data come from the project's own engine. New is the start network: it was retrained from scratch on 13,591,787,474 instead of 5.58 billion rows of own self-play. The fine-tuning by self-distillation follows the method already used for the predecessor in run T-0180. This entry describes structure, training, review and measurement. It was written at the operator's request. The oracle Elo Strength difference to the opponent, estimated from the games, with a 95-percent half-width where the oracle reported one. Never an absolute rating. values measure performance against the predecessor under oracle conditions; a preliminary result is marked separately below. None of these values is an external playing strength.
What changes
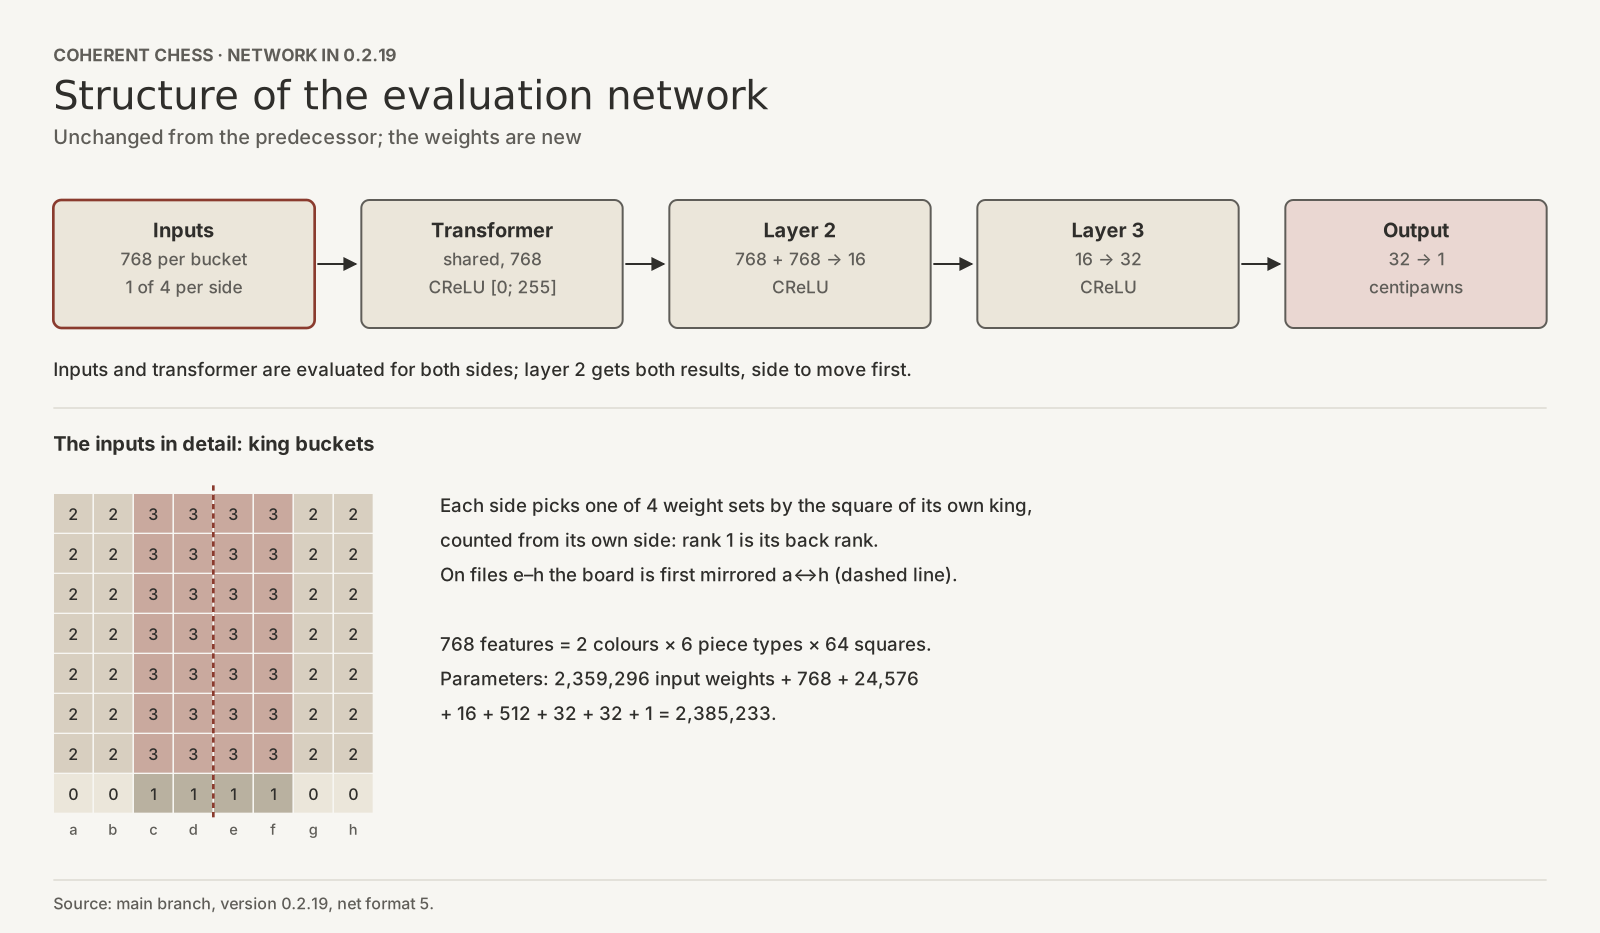
The change touches only the file with the network weights and the version number. The structure is the same as in the predecessor.
- Inputs: 768 features per side, 2 colours times 6 piece types times 64 squares, encoded relative to the side.
- King buckets: depending on the square of its own king, the network picks one of 4 weight sets. If the king stands on files e to h, the board is mirrored first.
- Feature transformer: 768 values per side in integer arithmetic, clipped to [0; 255] (CReLU). Both sides together give 1,536 values, the side to move first.
- Head: layers of 16 and 32 neurons, both CReLU, then one output in centipawns.
Together that is 2,385,233 parameters, of which 2,359,296 are input weights. All weights and the output scaling (154 instead of 159) are new.
Training in two steps
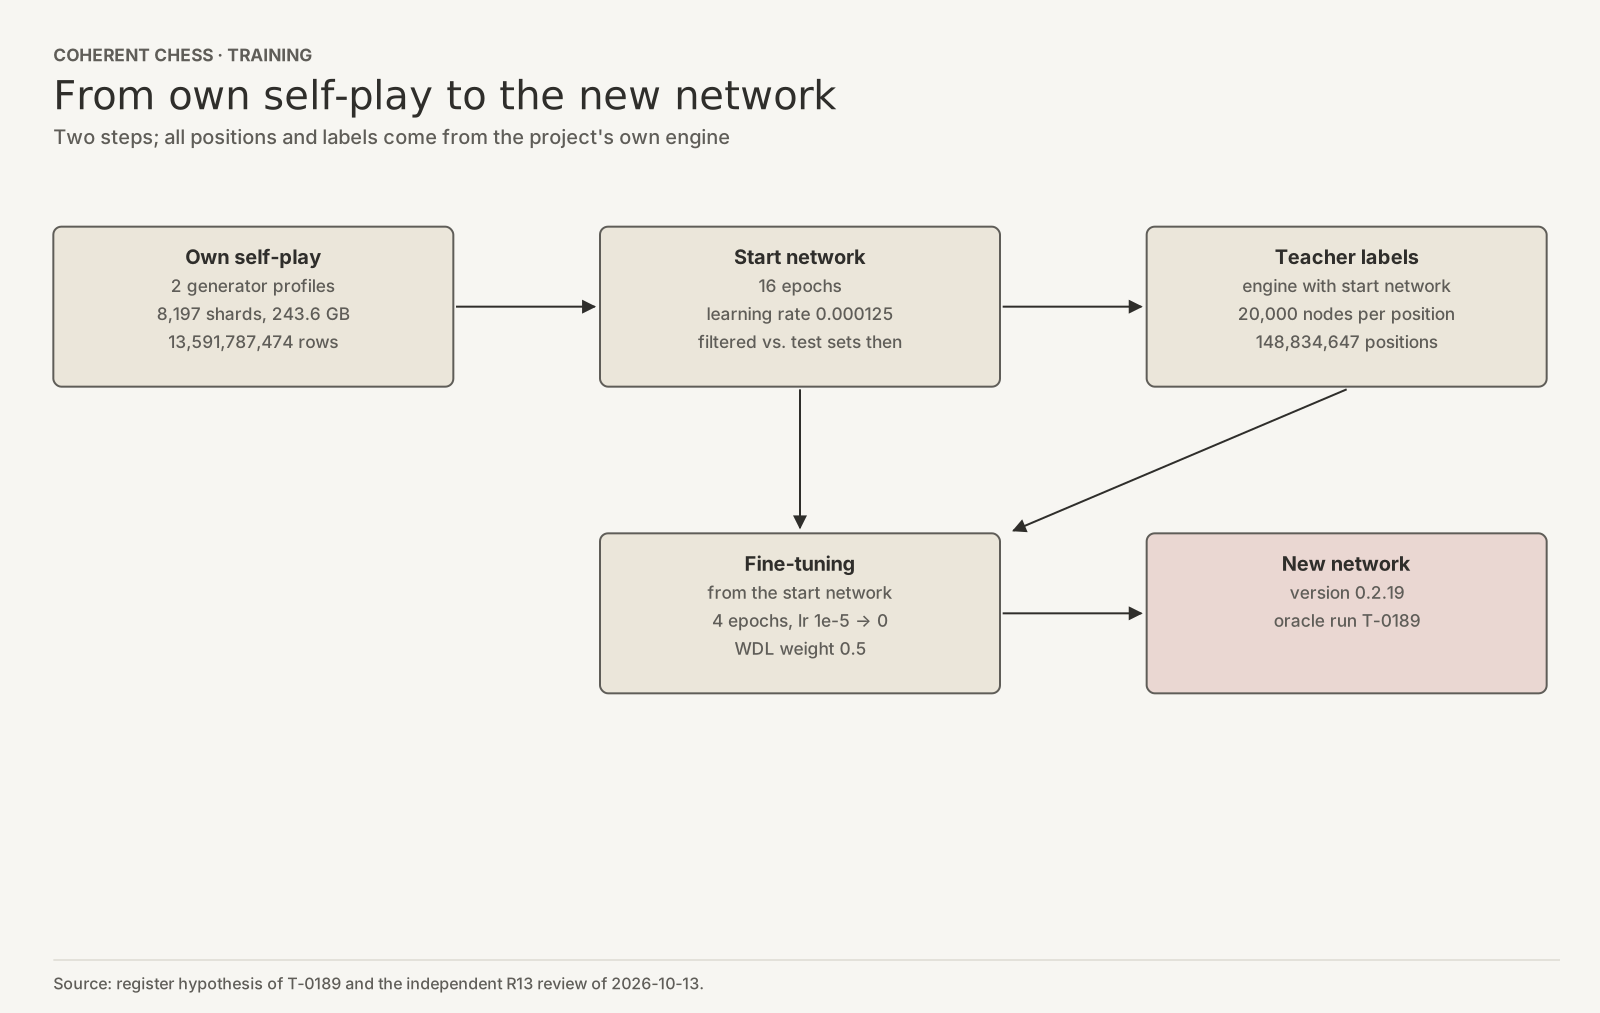
In the first step a start network was trained on own self-play: 8,197 data packages from 2 generator profiles, 243.6 GB, 13,591,787,474 training rows. Beforehand the data were filtered against the test sets available at that time, the positions the project measures with. Training ran for 16 epochs at a learning rate of 0.000125.
In the second step the engine with this start network searched 148,834,647 positions from the same self-play at 20,000 nodes each. These search results became new labels, and the start network was fine-tuned on them: 4 epochs, the learning rate falling per step from 1e-5 to 0, a WDL weight of 0.5. The network thus learns from the search that it guides itself; this is called self-distillation. Before labelling, the positions were filtered against 70 test-set contents, with 0 hits.
Review before measurement
The project's constitution requires an independent review of origin and data for every new network. It passed.
- Start weights, training code, recipe, seeds, data manifest and network file were confirmed by their hashes.
- The reviewer drew 8 of the 5,955 label parts by a rule fixed in advance and recomputed them: 200,000 rows, bit-identical, 0 deviations.
- 200,000 of 200,000 sample rows were found verbatim in the own self-play data. Third-party data: none.
- In the start network's data a full count found 1 row in 13,591,787,474 that belongs to a test set created later. That met the constitution's tolerance rule. This test set must not measure the network, and the evidence must be retained.
A preliminary match against the main branch at 8+0.08 seconds gave +17.39 Elo over 4,000 pairs, with a standard error of 1.54 and a one-sided lower 95 per cent bound of +14.85. That was a pre-test under different conditions, not an oracle result.
In the oracle
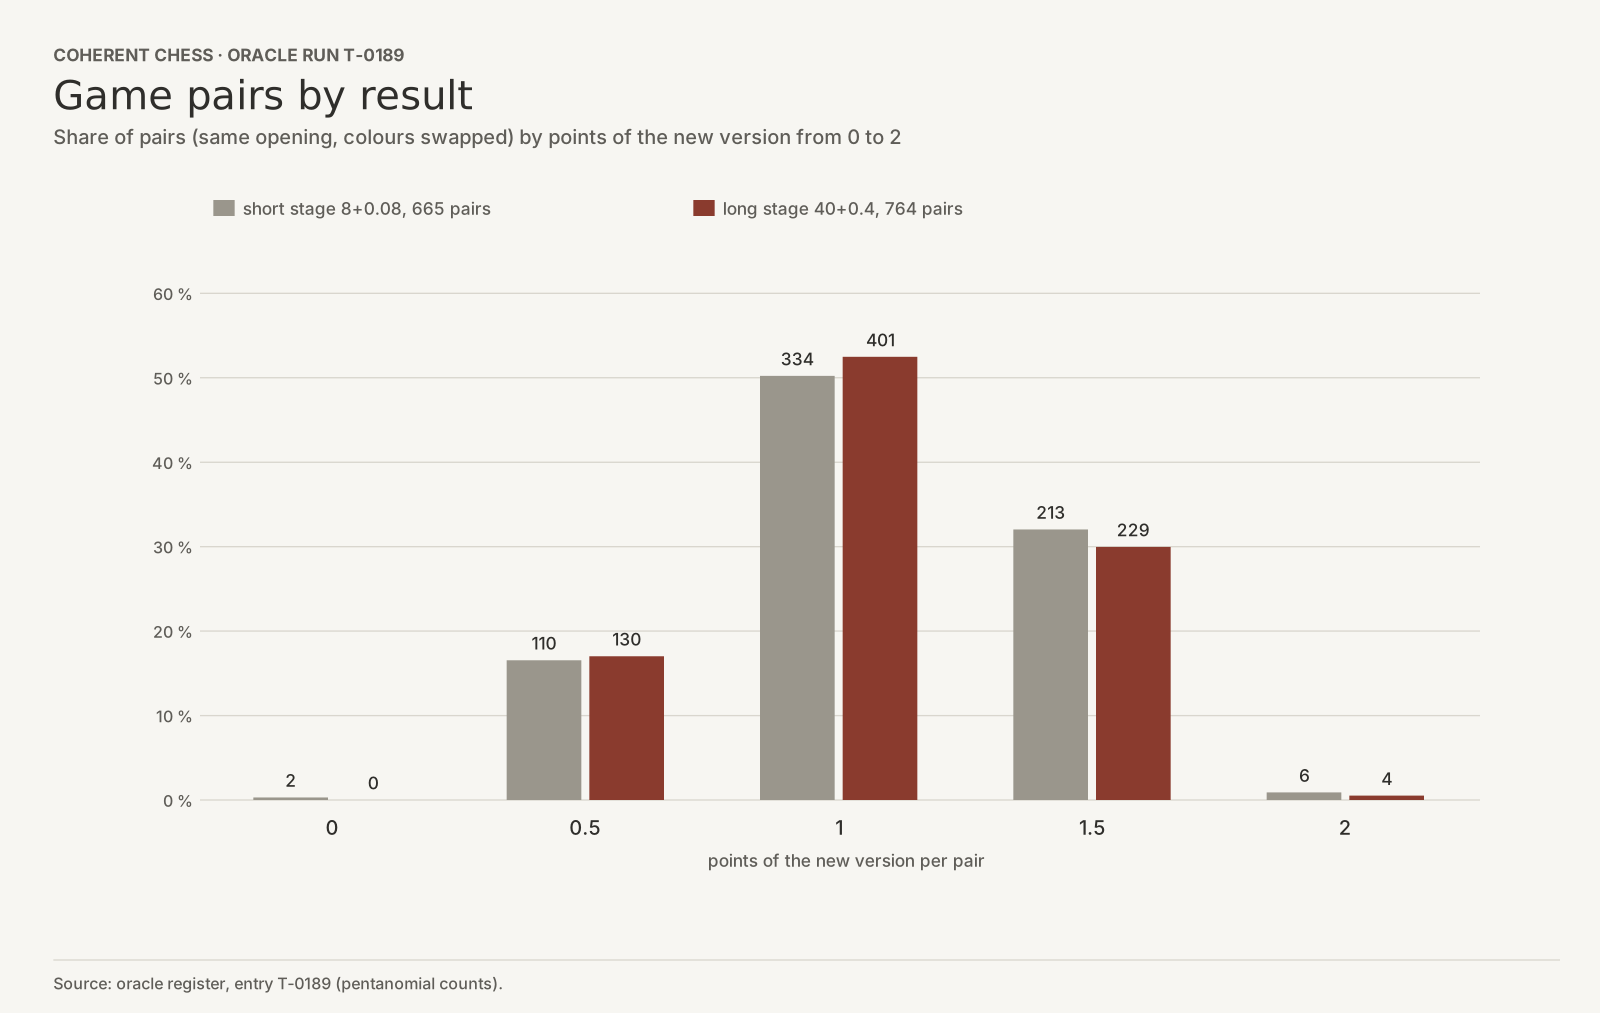
As usual the oracle tested in two sequential stages against the predecessor 0.2.18, with the hypotheses 0 and 5 nElo Normalised Elo: the Elo difference divided by the spread of the game results, so that the SPRT bounds mean the same at different time controls. and error rates of 0.05 each.
- Short stage, 8+0.08 seconds, Book A: upper bound after 1,330 games, 362 wins, 251 losses, 717 draws; +29.06 ± 9.46 Elo.
- Long stage, 40+0.4 seconds, Book B: upper bound after 1,528 games, 392 wins, 285 losses, 851 draws; +24.37 ± 8.50 Elo.
These are conditional logistic Elo estimates; ± gives an approximate 95 per cent interval from the final sample, without guaranteed coverage under sequential stopping. Both stages together took about 71 minutes. In the short stage this was the largest estimated gain since T-0174 of 2026-10-09. Because both stages ended at the upper bound, the point estimates may be biased upwards. The values should therefore be read as an order of magnitude.
What this shows and what it does not
Under oracle conditions 0.2.19 plays clearly stronger than 0.2.18 at both time controls. How much of this comes from the start network and how much from self-distillation was not measured separately in the oracle. The project's published anchoring data contain no external value for 0.2.19; the Elo values here do not carry over to an external scale.
How this was checked
The facts come from the oracle register, the code on the main branch, the register hypothesis and the records of the independent network review. For this entry the parameter count was recomputed from the array sizes in the code, the pentanomial Games are played in pairs with swapped colours; the five counts are the pairs scoring 0, ½, 1, 1½ and 2 points. counts were checked against wins, losses and draws, and the comparison with earlier runs was recomputed from the register. An agent of another model family checked the text against the same sources.