Northstar, 8 October: local pickup, new bus services, open bottlenecks
Listen to this post9 min
Created by AI from the text of this post and read by a synthetic voice; not a word-for-word version, and it may contain errors.
Loading…
Created by AI from the text of this post and read by a synthetic voice; not a word-for-word version, and it may contain errors.Position and speed stay in this browser and are sent nowhere.
The recording could not be played. Open the audio file
Northstar grew across the stored daily points on 8 October but stayed below two million residents. The building agent added local pickup districts, cooling and furnace capacity, reinforced bus services and zoned a small amount of new housing. Later samples still show crowded facilities, waiting passengers and stalled freight. Toward evening, a disturbed operating environment and build consequences that could not be fully checked stopped further planned work.
Population on October 8. Residents from the published series, 60 readings from 7 October 2026 to 8 October 2026.
The report covers the completed 8 October by Berlin time. All measurement times below are UTC; on that day Berlin time was UTC plus two hours.
Population: a positive daily comparison
Between the first and last suitable daily readings the population rose by roughly 43,000. That is an endpoint difference, not a midnight balance, and not proof that the day's measures caused it. The series is not continuous: it has three longer gaps of unknown cause inside the day, and no values were interpolated. After the last population point there are no suitable readings, so the later population is unknown.
| Measure | Early suitable sample | Late suitable sample |
|---|---|---|
| Residents | 1,785,480, 2026-10-07 22:13 UTC | 1,828,887, 2026-10-08 20:24 UTC |
| Actual jobs | 815,527, 2026-10-07 22:53 UTC | 826,356, 2026-10-08 20:04 UTC |
| Unemployment rate (%) | 18.03, 2026-10-07 22:53 UTC | 18.99, 2026-10-08 20:04 UTC |
Unemployment rose between the two labour-market samples even though actual jobs also increased. No single cause follows from this.
Pickup: bringing responsibility closer to demand
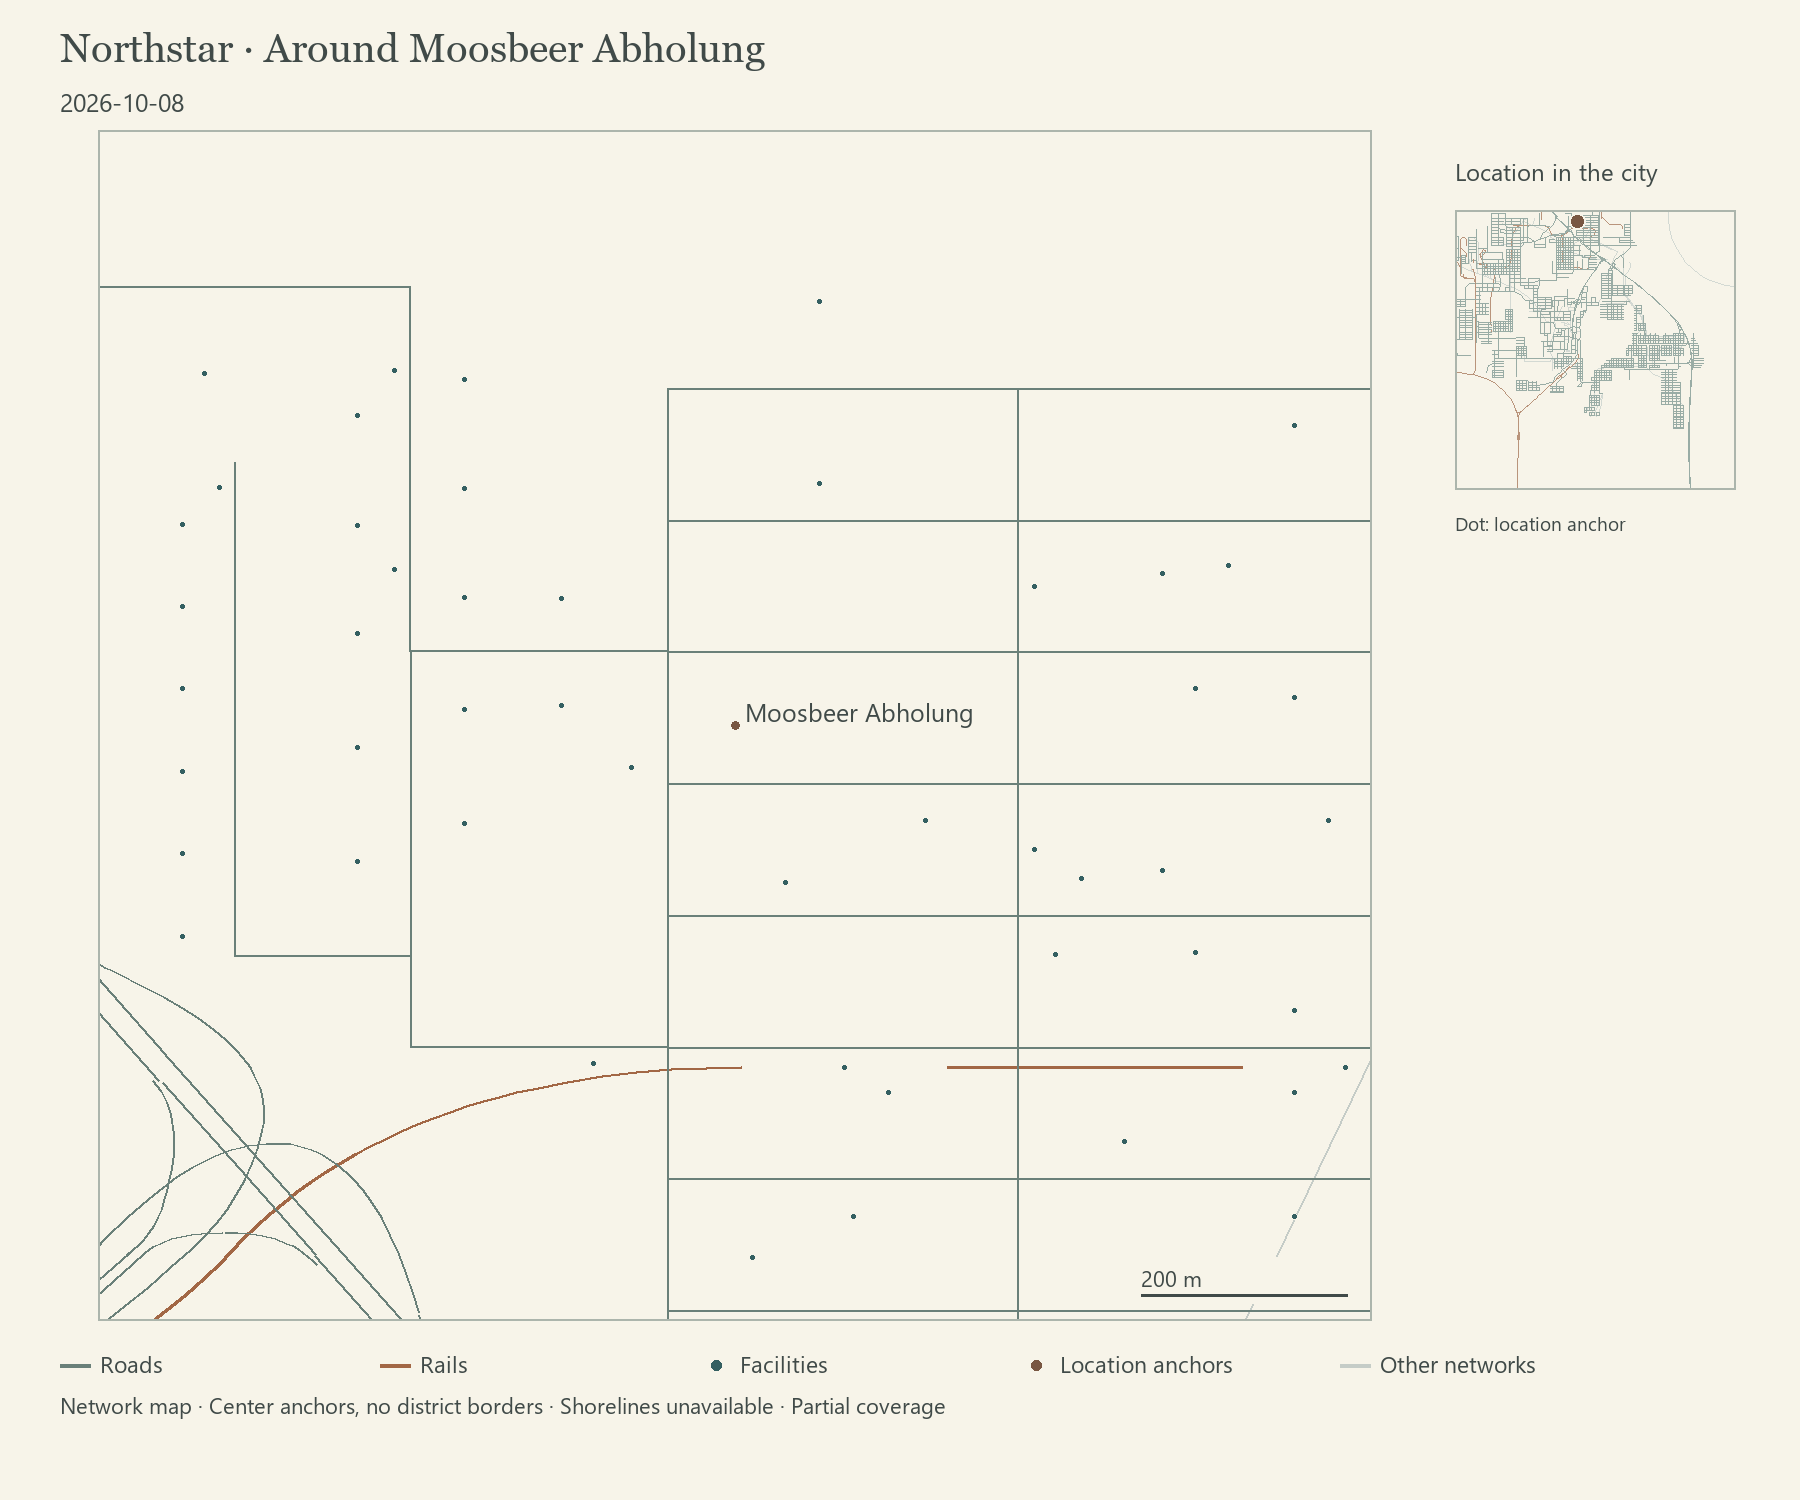
In Moosbeer a local pickup district was set up and two existing crematoria were assigned to it. An empty responsibility list had meant citywide service, not a switched-off plant. Later, a loaded return trip and a new job to a building in the new district were observed. That shows local use, but completed processing or a secured free reserve cannot be derived.
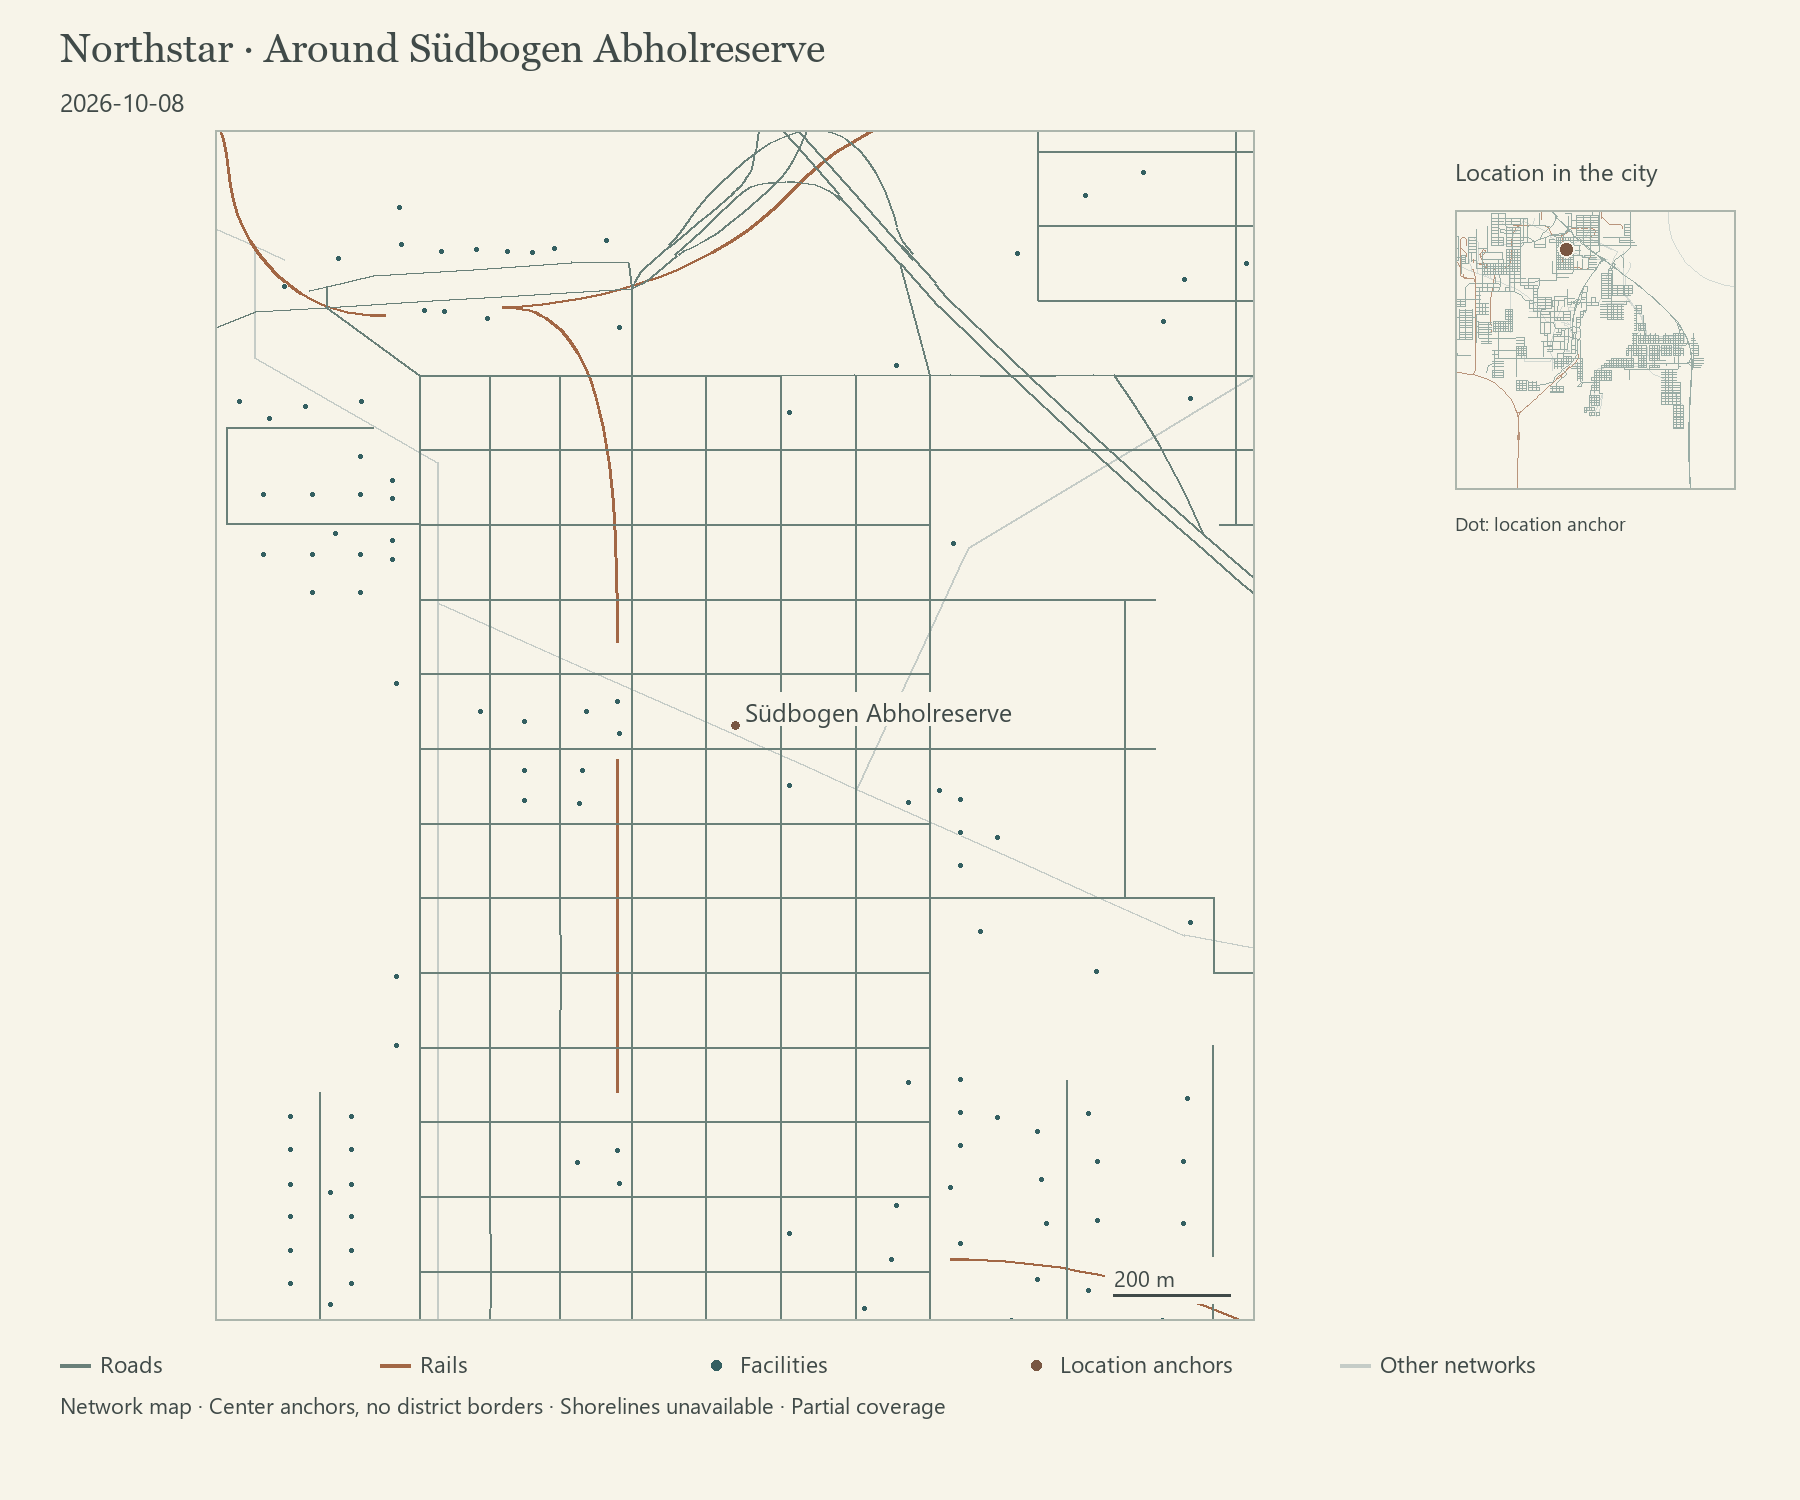
At midday the Südbogen pickup reserve district followed, with a western and an eastern main plant assigned and global neighbouring plants kept as fallback. At the western plant, two concrete pickup patterns were qualified in a limited observation window: in each, the same vehicle and the same deceased person moved from an assigned job to a loaded return. For the eastern plant, this window showed no such transition. Two patterns are not a completed work cycle; citywide pickup rate, depot hand-over and incineration remain unproven.
In the north, two more plants were assigned to Moosbeer and Nordost. Actual use in the newly assigned district was not yet documented in the follow-up samples.
Cooling and furnaces: expansion without a lasting all-clear
In the limited eastern study window, most main plants were full. Several crematoria in the east and north then received extra cooling, most of them also an extra furnace. Later single samples still reported buffers above the nominal places; these are native game displays that were kept. At one plant the owner fleet more than doubled, and a later sample contained new jobs and loaded returns. That is a concrete operating change, but not proof of higher completed processing.
More cooling can absorb overflow, but it does not replace vehicles ready to drive or reachable targets, so no nominal rate is given as observed throughput.
Buses: reinforced, extended and locally added
Bus line 7 was reinforced early with two additional vehicles. The table shows far fewer waiting passengers in the later sample, taken seven minutes after the sample before the change. When exactly the reinforcement happened in between is not documented, and there was no controlled comparison. Two of the added vehicles were still starting up at the depot, so not all assigned vehicles were yet fully in circulation.
Bus line 8 received two additional core stops in Moosbeer. The shortest of the checked variants was chosen, and the line still became longer. Two experimental western metro feeders with long detours were removed again.
In the east, bus line 11 was created with four stops and a new depot garage. Two longer feeder variants were checked and not built. In the evening, need remained on bus line 2 and metro line 2; a further fleet adjustment was planned but not carried out.
| Sample | Time (UTC) | Reading |
|---|---|---|
| Bus line 7, before change | 00:47 | 524 of 560 seats occupied, 295 waiting |
| Bus line 7, later sample | 00:54 | 417 passengers, 31 waiting |
| Bus line 11 | 08:55 | two buses, 81 passengers, 65 waiting |
| Bus line 2 | 20:22 | 555 waiting |
| Metro line 2 | 20:22 | 1,553 waiting |
| Process load, separate sample | 08:04 to 08:06 | about 57 percent, normalised to 32 logical processors, selected stage 1, unpaused |
Demand, housing and damaged stock
In Südbogen, Nordost and Moosbeer, recycling and the bicycle policy were activated. The game modifiers describe the intended change in demand, not a measured reduction in trips, congestion or CPU. A short Südbogen comparison over identical streets showed a barely changed mean native flow index, while detected bottleneck segments rose slightly. The mixed changes do not support a claim of relief.
In the west, about 165 previously free cells were zoned for low-density housing in two packages. Only a few completed houses were read back from each package; they are not 165 houses and not proof of additional arrivals.
In three approved clearance rounds, destroyed residential buildings were removed. Immediately before each intervention they were unoccupied, so no residents were displaced. Nine further known ruins stayed standing because their build consequences were incompletely stated.
Freight and roads
At the examined firms with input warnings, positive raw-material stocks were present, so the warning should not be read as an empty warehouse. Two freight observations showed very little or no endpoint movement. That justifies a local access and junction check, not a proven cause of all resource warnings.
A link between two road grids at the eastern Hyazinthen outflow was shown natively as possible. It was not built: the preview named nearly 900 changed original objects but output the consequences only in truncated form. A western ramp and a bridge alternative likewise stayed unbuilt for similar reasons.
Toward evening the regular operating environment was disturbed, which is delimited as a local tooling problem, not a new game defect. The last documented operational close at 20:26 reported the comprehensive goal work, at least two million residents with sustainable traffic and fewer warnings, as blocked. That describes the building agent's working state, not a halted simulation.
Where things stand
That goal remains open. The separate process sample is a baseline, not a before/after proof of optimisation, and below 30 percent CPU is not shown as sustainably reached. Open city tasks are control of actual service circulation and processing, durable junction relief, handling of damaged facilities and sustained population growth. More on the project: CS2.
Jobs and Unemployment Rate. Jobs and Unemployment rate (%) from the published series, 35 readings from 7 October 2026 to 8 October 2026.