Why queues return: what Northstar's interventions have shown so far
Listen to this post8 min
Created by AI from the text of this post and read by a synthetic voice; not a word-for-word version, and it may contain errors.
Loading…
Created by AI from the text of this post and read by a synthetic voice; not a word-for-word version, and it may contain errors.Position and speed stay in this browser and are sent nowhere.
The recording could not be played. Open the audio file
Northstar still has several congested areas. In some places queues partly dissolve between two observations, in others they persist after an intervention. This post covers the state on 7 October 2026; the last completed work segment taken into account ends at 11:12 UTC. None of the checked interventions shows a clear easing of congestion, and the effect of the one new bus link remains open.
Kieselbach/Frühlings Junction: same set of 17 roads. Values per step in Index 0–1: Vor Pilot 0.094, Mit Pilot 0.088.
The human-set goal combines sustained growth to at least two million actually simulated inhabitants with less congestion, while protecting existing residents and their supply. That joint goal has not yet been reached. A lower CPU load could only be judged together with real simulation work and throughput: a pause, a lower speed or a loss of population would not count as an optimisation success.
Orientation: several places, different problems
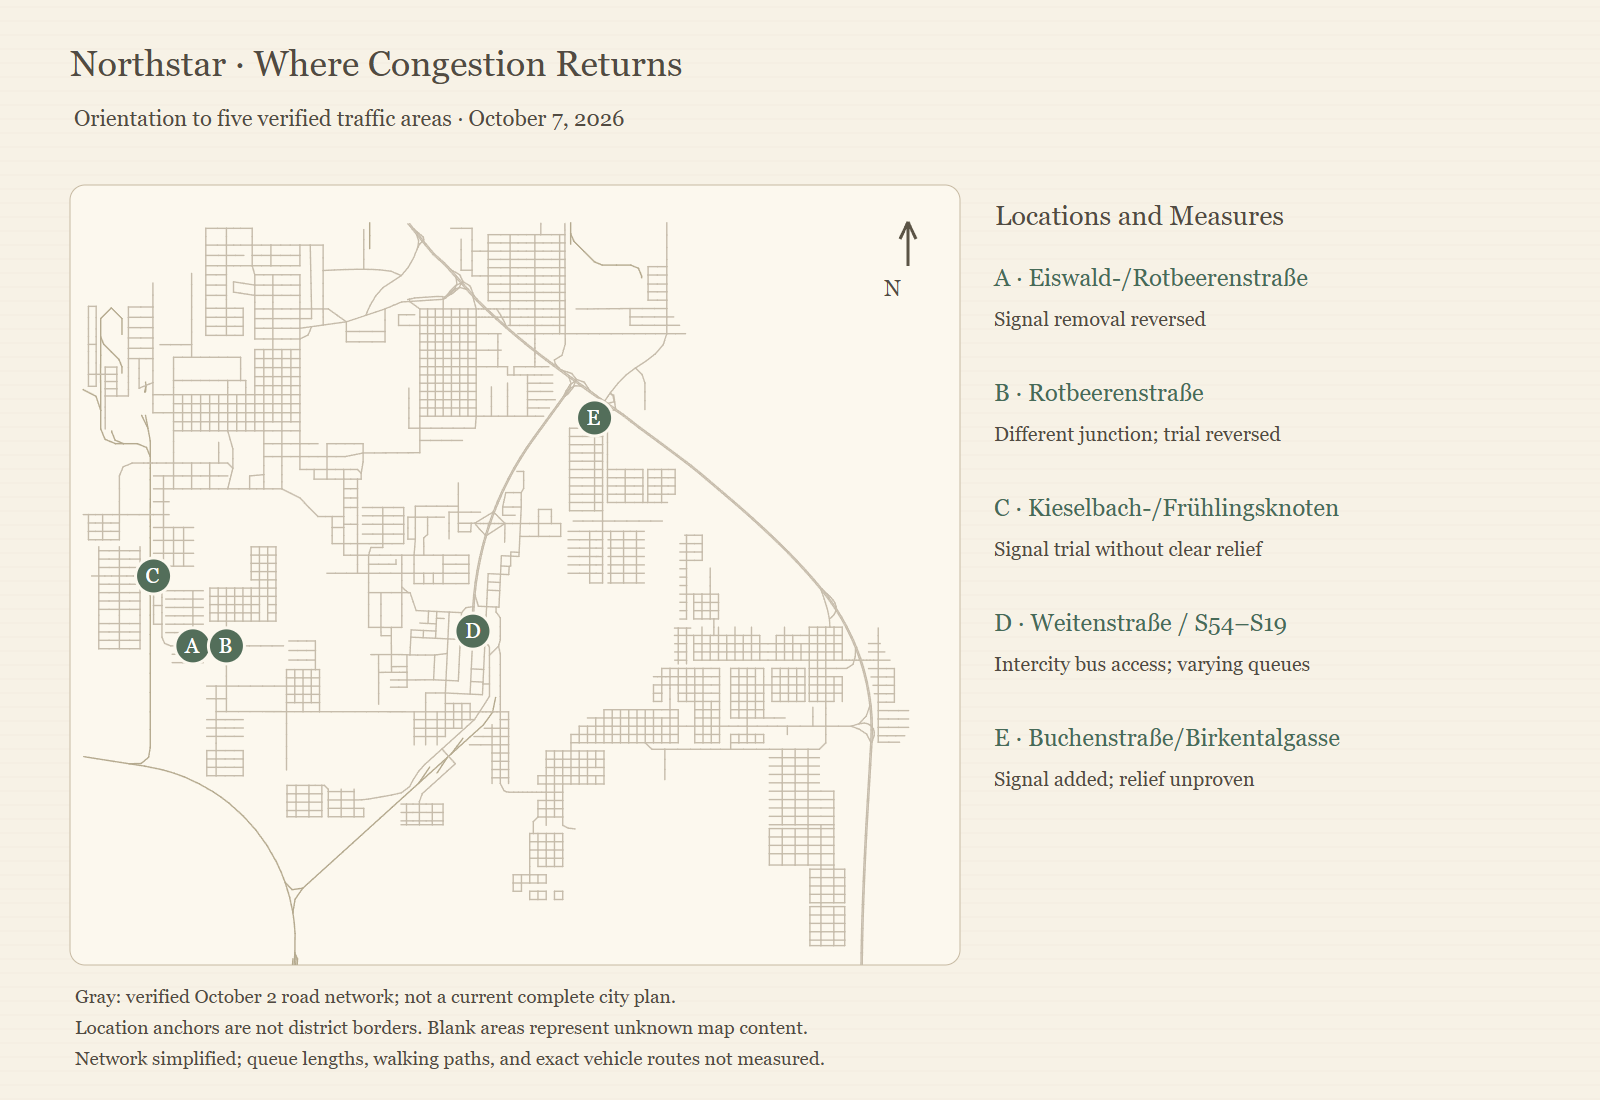
A is the Eiswald/Rotbeeren junction, B a different Rotbeeren junction, C the Kieselbach/Frühling junction. Further east lie the central coach inflow at Weitenstraße with S54/S19 (D) and the Buchenstraße/Birkentalgasse junction (E).
The grey network base dates from 2 October and serves for orientation. The newer observations are local and individually dated, so they do not add up to a simultaneous picture of the whole city. Drawn road connections are not measured vehicle trajectories or exact queue lengths.
West: signal changes without clear improvement
On 5 October an existing signal at the Eiswald/Rotbeeren junction was removed. The queue remained visible in several probes and in the junction view, so the building agent restored the signal. Across ten identical road segments the mean native flow index barely rose, and one bottleneck marking disappeared. The visible queue stayed.
On 7 October a limited signal pilot followed at another four-arm Rotbeeren junction. The flow index of the eight identical segments stayed roughly level across four readings, and the pilot was reverted. The original road geometries and the checked neighbouring buildings were preserved.
At the Kieselbach/Frühling junction, queues were documented on three arms on the morning of 7 October. The adjacent railway already lies about eleven metres above ground, so a level crossing is not a documented explanation for this queue. The mean flow index of the same roads fell slightly between two readings about five and a half minutes apart. This signal pilot was also reverted.
| Location | Measure | Mean flow index |
|---|---|---|
| Eiswald/Rotbeeren (A), 10 segments, 395.164 s apart | Signal removed, then restored | rise of 0.0005 |
| Other Rotbeeren junction (B), 8 segments | Signal pilot, four readings | 0.34525 → 0.346625 → 0.34450 → 0.341875 |
| Kieselbach/Frühling (C), 17 roads | Signal pilot, 11:00 → 11:05 UTC | 0.094294 → 0.088176 |
An additional road curve at Kieselbach was not built. Its preview bound the start node incorrectly and would have affected existing industrial buildings; further consequences were available only in truncated form. This speaks against that connection, not against every conceivable bypass.
The trials give no general rule that signals help or harm. They are limited, uncontrolled local comparisons. Turning flows, receiving roads and safe alternative connections need clarifying before the same interventions are repeated.
S54/S19: the queue changes without rebuilding
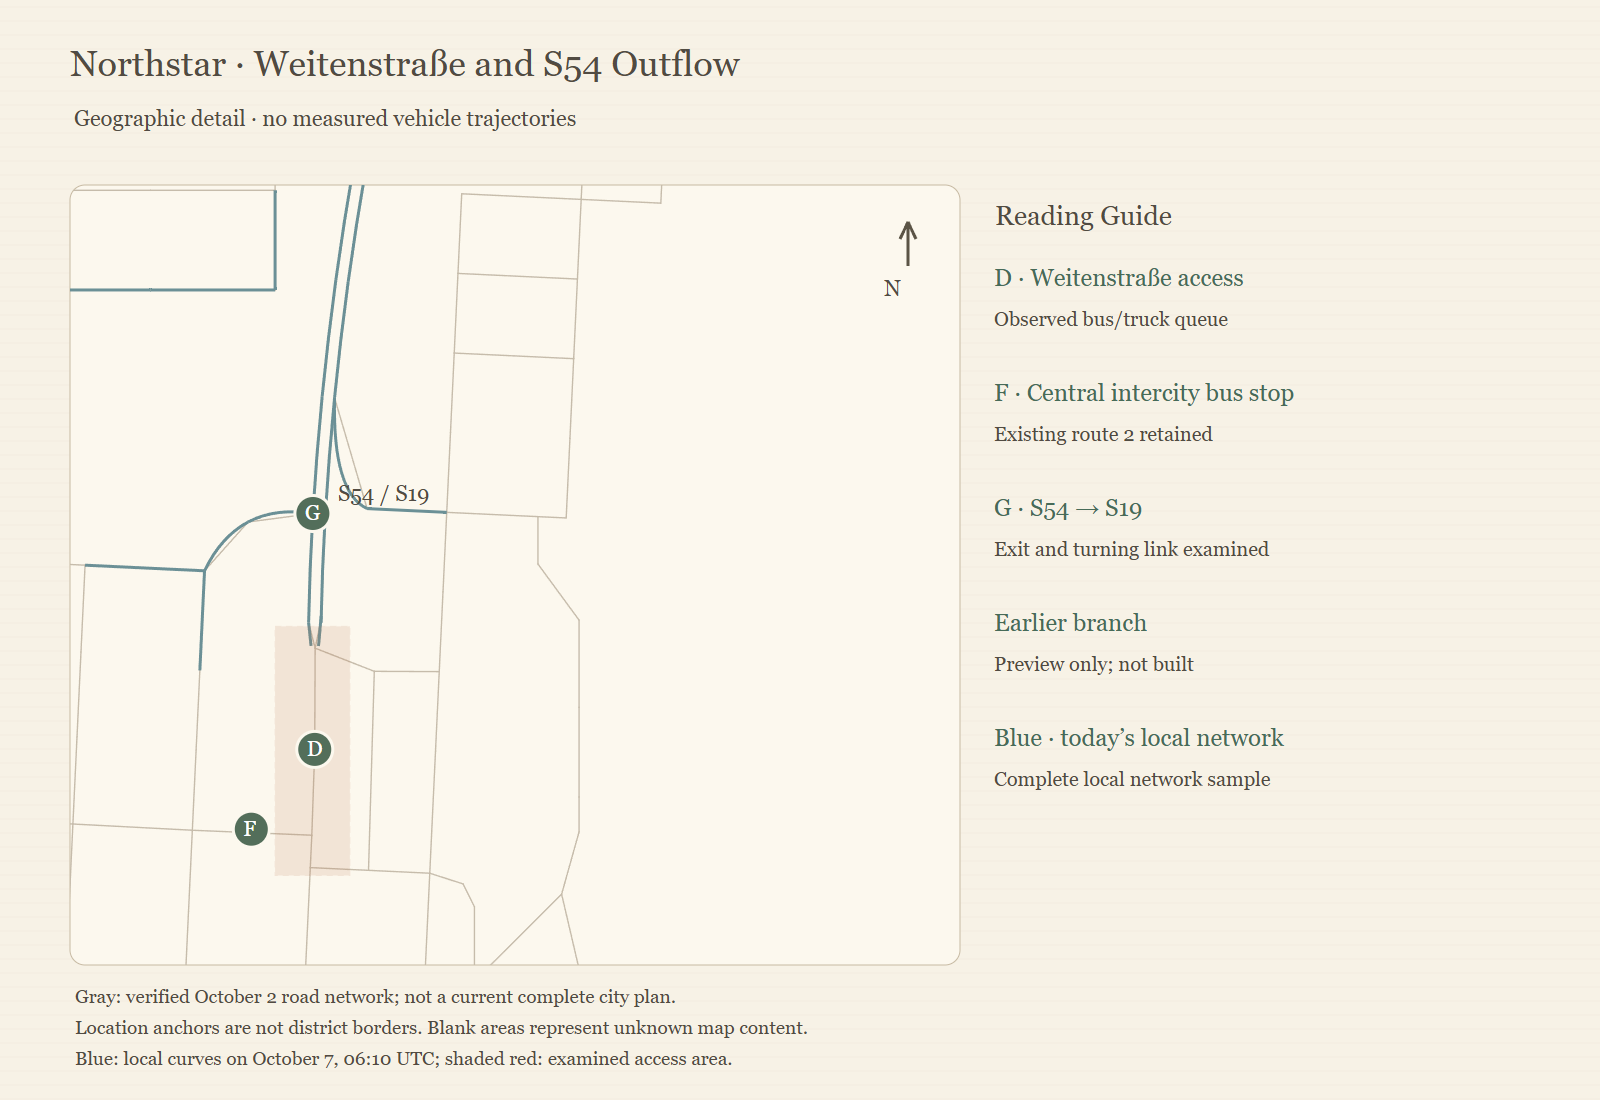
An early-morning view of the S54 showed a long truck and car queue, mostly on one lane. Later it was markedly shorter. Trucks were seen on the S19 exit and on the short turning link; their distribution was not counted. The downstream city junction showed no continuous queue in the checked view.
Two complete probes of the same 20 edges gave a mean flow index of 0.452, then 0.456. Nothing was rebuilt in this section, so the slight change proves neither a successful measure nor lasting relief. It shows why a single snapshot does not describe a lasting queue.
An earlier branch with a planned total length of about 260 metres remained a preview. Its effect on the inhabited zone candidates was not fully qualified, and it would have used the same S19 outflow. It would not have been an independent relief route; a wider approach might merely move the bottleneck.
Weitenstraße: an added coach link, no reduction in queues yet
The central coach inflow was also under real load. Most of the completely recorded local road segments lay in the lower half of the flow index scale, and a few carried bottleneck markings. Identical coaches were compared across two probes a few minutes apart: some had the same end position, others had moved. Equal end points do not prove uninterrupted standstill between the probes, and the absence of error or stuck flags does not mean free flow.
Bus 9 was added as an extra link. It uses an existing northern city stop, already served by Bus 4, and directed outer stops for exit and entry. The old line 2 and its central stop remain. The new full loop is about 53 percent shorter than the previous outer line, with different city stops. That does not amount to an equal door-to-door time saving.
A follow-up probe at 09:21 UTC showed three buses with passengers aboard and people waiting, running free of charge day and night. Movement is documented. Whether the link takes over enough travellers to reduce the central queue lastingly is open.
At the eastern Buchenstraße/Birkentalgasse junction a signal was added on 7 October; service buildings and road geometries were preserved. Most local segments there still lay in the lower half of the flow index scale. No relief is documented there either.
| Measurement | Value |
|---|---|
| Weitenstraße, 08:54 UTC: segments below flow index 0.5 / with bottleneck markings | 34 of 42 / 2 |
| Ten identical coaches, about 195 s apart: same end position / moved | 6 / 4 (moved by roughly 514 to 660 m) |
| Bus 9 full loop / previous outer line | 7.692 km / 16.390 km |
| Follow-up 09:21 UTC: passengers aboard / waiting | 98 / 122 |
| Buchenstraße/Birkentalgasse, 08:41 UTC: segments below 0.5 | 16 of 21 |
What the readings say and what is missing
The native flow index from 0 to 1 is not a counted vehicle rate. Warnings, indices, visible queues and actual trips have to be read together. The checked interventions document executed changes, reversals and a new bus link. They do not document a congestion-free city, a secured reduction in travel time or a controlled CPU advantage.
Still open are real turning flows, receiving roads, complete bus loops and the queue under repeated load. The measurement windows are uncontrolled, and local findings do not transfer to the whole city.