The label error curve: accuracy, cost and effect of deeper labels
Listen to this post16 min
Created by AI from the text of this post and read by the synthetic voice “Sulafat”; not a word-for-word version, and it may contain errors.
Loading…
Created by AI from the text of this post and read by the synthetic voice “Sulafat”; not a word-for-word version, and it may contain errors.Position and speed stay in this browser and are sent nowhere.
The recording could not be played. Open the audio file
Coherent trains its evaluation network on positions from its own games. Each position gets a label: the evaluation of a search of the engine, in data generation with 5,000 nodes per move. A deeper search costs more computing time. The "label budget" measurement series measured how close the labels come to a deep reference search depending on the node count, what they cost, and whether a network learns more from deeper labels. A post from 2026-10-26 showed extracts; this post presents the whole series. It was written at the operator's request and makes no statement about playing strength: all measures are distances to a deep reference search of the same engine, or predictions of the game result.
In short
- The label error against the reference search falls from
6.19thousandths at625nodes through3.58at5,000nodes to1.13at80,000nodes. - The computing time per game rises to
3.57times at20,000nodes and to6.91times at40,000nodes. - Networks that learned from the same
300,000games relabelled with20,000or40,000nodes differed in network error from networks with5,000-node labels by a log contrast of−0.49and−0.31%. Under the rule fixed in advance this is no demonstrable difference; the one-sided upper95% limits were+3.87and+4.05%. - The networks from deeper labels predicted the game result worse by
0.0017and0.0023nats. The series ended as planned after stage1. - The finding applies only to relabelling afterwards, at the same data volume and a fixed network width of
768.
The measures
- Label: the evaluation of a position by a search with
knodes. - Label error E(k): the mean of
(σ(label/205) − σ(reference/205))². σ is the logistic function; it turns an evaluation in centipawns into a value between0and1. The reference is a search of the same engine with5.12million nodes and an empty search cache. - Warm and cold: warm, the search runs as in data generation: one engine process per game, the game move by move, the search cache from earlier moves is kept. Cold, the search cache is cleared before every position.
- Network error M: the same measure for the evaluation of a trained network, on a frozen measurement set.
- Log-loss: how well an evaluation, converted into a probability with a fitted scale, predicts the result of the game. Measured in nats; smaller is better.
- Log contrast:
100times the difference of the natural logarithms of two values, given in %. For small differences it is roughly the percentage change.
Stage A: how accurate is a label?
From twelve runs of our own data generation, 10,008 games were drawn, two positions per game. 20,015 positions could be evaluated. Each was evaluated again with five node counts, warm and cold, and compared with the reference. At 5,000 nodes the replayed rows matched the delivered ones bit for bit.
The label error falls with the node count; cold it is 1.27 to 1.99 times as large as warm. warm, as in data generation: 625 6.19, 1,250 5.29, 5,000 3.58, 20,000 2.14, 80,000 1.13; cold, empty search cache: 625 7.88, 1,250 6.73, 5,000 5.02, 20,000 3.59, 80,000 2.25.
Nodes k | E warm, thousandths | 95 % band | E cold, thousandths | cold/warm | λ*(k) | Search depth warm / cold, plies |
|---|---|---|---|---|---|---|
625 | 6.19 | 5.95 – 6.42 | 7.88 | 1.27 | 0.144 | 5.7 / 5.3 |
1,250 | 5.29 | 5.08 – 5.48 | 6.73 | 1.27 | 0.127 | 6.8 / 6.2 |
5,000 | 3.58 | 3.43 – 3.74 | 5.02 | 1.40 | 0.086 | 9.7 / 8.3 |
20,000 | 2.14 | 2.04 – 2.24 | 3.59 | 1.68 | 0.056 | 12.7 / 11.1 |
80,000 | 1.13 | 1.07 – 1.19 | 2.25 | 1.99 | 0.031 | 16.5 / 14.5 |
- Bands: bootstrap over whole games with
2,000draws. - Shape: over the whole range,
Eproportional tok^−αfits, withα = 0.349and a band from0.340to0.360. On two logarithmic axes the curve gets steeper over the measured intervals: the magnitude of the slope is0.23(0.19–0.27),0.28(0.26–0.30),0.37(0.35–0.40) and0.46(0.43–0.49). 5,000against20,000nodes: the label error falls by40.3%, band38.4to42.2%.- Cold and warm: cold, the error is
1.27to1.99times as large as warm, and the warm search reaches more depth at the same node count. Whether this is real accuracy or only more similar search trees, the measurement does not separate. - λ(k):* the weight of the game result at which a mix of label and game result on the σ scale would come closest to the reference. It falls with the node count from
0.144to0.031. The stage1networks learned with the weight0.1. - Recalculation: an independent second implementation confirmed all decision quantities of stage A, with at most
0.006% relative deviation.
How deep must the reference be?
The reference, too, is only a finite search. That is why 2,000 control positions from 1,000 games were evaluated against three reference depths.
| Reference, nodes | α | 95 % band | Decrease from 5,000 to 20,000 nodes | 95 % band |
|---|---|---|---|---|
1,280,000 | 0.400 | 0.363 – 0.439 | 43.0 % | 34.4 – 50.2 % |
5,120,000 | 0.336 | 0.307 – 0.364 | 38.1 % | 31.7 – 43.8 % |
20,480,000 | 0.279 | 0.256 – 0.302 | 33.5 % | 28.4 – 38.1 % |
- The deeper the reference, the smaller the measured decrease. Paired on the same positions, it is
4.6percentage points smaller against20.48million nodes than against5.12million nodes, band2.8to6.3. - The classification "more" fixed in advance (lower limit of the decrease at least
10%) held at all three depths. - Cross-check: for
100of100positions the reference search with5.12million nodes gave the same evaluation and depth in both runs.
What deeper labels cost
200 games from 180 runs of data generation were replayed completely warm with 5,000, 20,000 and 40,000 nodes on a fully loaded machine. Calibrated against the throughput of data generation, this gave a factor of 1.243.
Nodes k | Cost per game, relative to 5,000 (95 % band) | CPU seconds per game, calibrated | Extrapolated thread hours for 300,000 games |
|---|---|---|---|
5,000 | 1 | 0.60 | 49.7 |
20,000 | 3.57 (3.56 – 3.60) | 2.13 | 177.7 |
40,000 | 6.91 (6.86 – 6.95) | 4.12 | 343.4 |
The five most expensive of the 200 games accounted for 4.9 % of the cost.
The measurement set for networks
- Size:
48,807games with92,314positions, each evaluated with the cold reference of5.12million nodes. - Deduplication: positions that also occur in training data were removed; checked against
600training runs with872million rows,74,934hits. This lowered the share of positions with at most nine pieces from32.5to26.9%. All values of M apply to this distribution. - Hold-out set for the log-loss:
11,009games; the scale is fitted on1,178games and measured on the remaining9,831. - Blindness check: on
12existing networks of the same design, M ordered all7network pairs fixed in advance in the expected order. This shows that M sees differences between networks; it gives no conversion into playing strength.
Preliminary stage: network error and data volume
Before the main experiment, networks of width 768 were trained with 5,000-node labels from 150,000, 300,000 and 1,200,000 games, each for 16 epochs with a result weight of 0.1.
More training games, lower network error: from 11.68 to 8.99 thousandths. networks of width 768 with 5,000-node labels: 150,000 11.68, 300,000 10.64, 1,200,000 8.99.
Games N | Training rows per epoch | Seeds | M, thousandths, mean | Spread of ln M between seeds | Log-loss, mean |
|---|---|---|---|---|---|
150,000 | 10.9 million | 2 | 11.68 | 0.0032 | 0.4082 |
300,000 | 21.7 million | 2 | 10.64 | 0.0050 | 0.4029 |
1,200,000 | 86.9 million | 4 | 8.99 | 0.0064 | 0.3936 |
- Repetition: a second run with the same seed at
300,000games gave bit-identical networks and the same value of M. - Planning stage
1: from the spread at1,200,000games the rule set a minimum spread of0.0372, twice the upper95% bound. As reference effect it assumed: if a network took over the label gain from5,000to40,000nodes with the factor0.81, the log contrast of M would be−16.7%. The original planning model gave a power of0.989at half that effect with4seeds. The analysis rule was changed afterwards and tested separately (next point). - Acceptance of the rule: before the first training of stage
1, the final rule was simulated in a predefined grid of1,314synthetic test cells. Without a real effect it wrongly continued there in at most7.5% of cases. In the cells with normally distributed spread and the assumed measurement error it detected half the reference effect in at least89.2% of cases; across all cells with normally distributed spread its limits covered the true value in at least92.5% of cases. Limits: with a strongly skewed distribution between seeds, the power at half the reference effect falls to0.657; if the true spread were twice the minimum spread, there would be no bound on the error rate below10% with4seeds. - Consequence of the minimum spread: under this rule a negative log contrast must reach a magnitude of at least about
4.25%. This is necessary but not sufficient: the one-sided upper95% limit must be below zero.
Stage 1: does a network learn more from deeper labels?
The first 300,000 training games were relabelled warm with 5,000, 20,000 and 40,000 nodes. Games, positions and results stayed the same. For each node count, 4 networks learned with 4 seeds, in all three arms with the same starting weights and the same batch order, for 16 epochs each. The deciding comparison was 40,000 against 5,000 nodes; 20,000 nodes was evaluated descriptively.
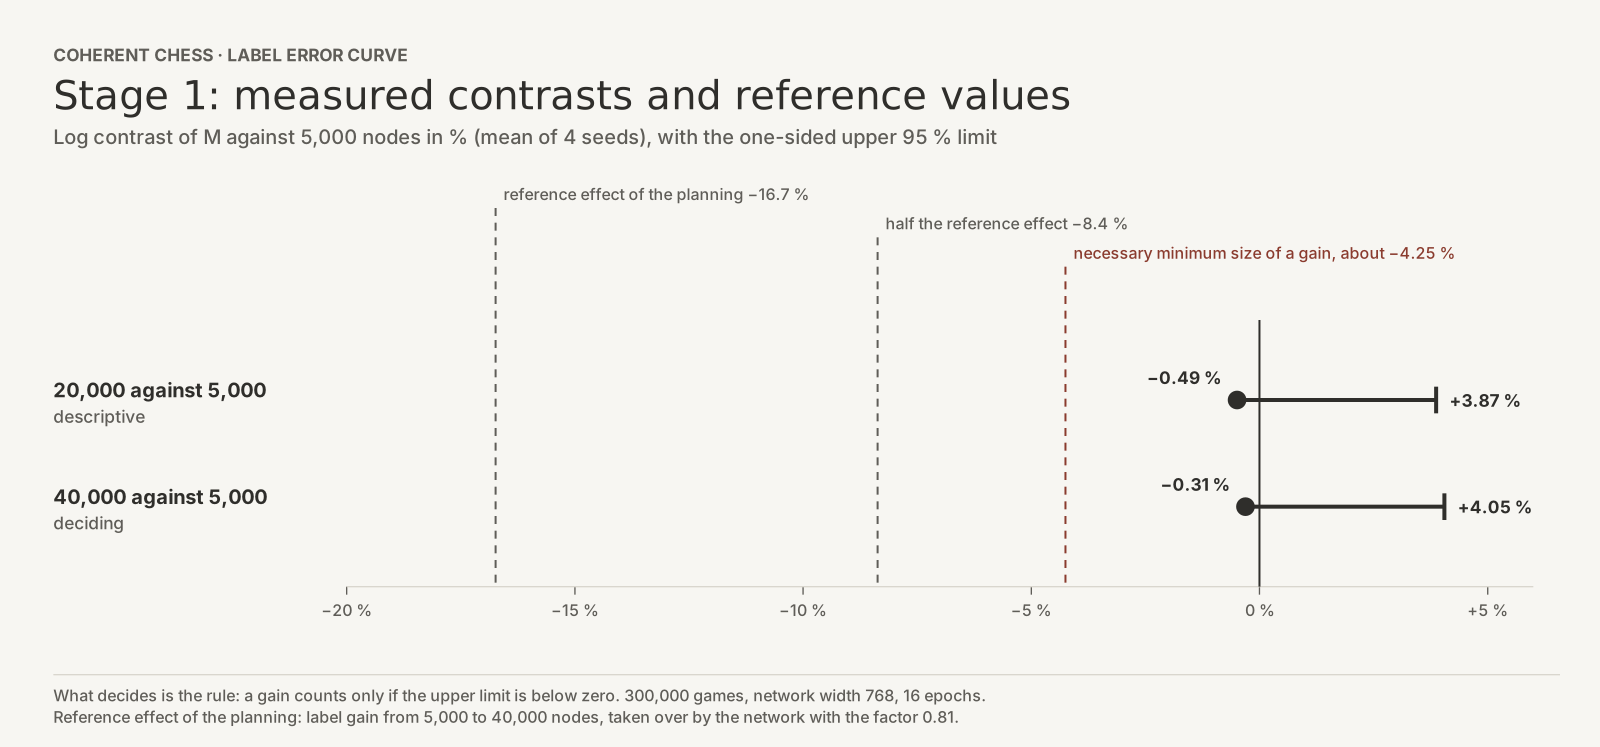
| Labels, nodes | M, thousandths | Log contrast of M against 5,000 | Standard error under the rule | Upper 95 % limit | Standard error, observed | Log-loss | Difference (lower limit) |
|---|---|---|---|---|---|---|---|
5,000 | 10.654 | – | – | – | – | 0.4026 | – |
20,000 | 10.602 | −0.49 % | 1.87 % | +3.87 % | 0.33 % | 0.4043 | +0.0017 (0.0015) |
40,000 | 10.622 | −0.31 % | 1.88 % | +4.05 % | 0.32 % | 0.4049 | +0.0023 (0.0020) |
- Network error: a gain would only count if the one-sided upper
95% limit were below zero. For the deciding comparison it was+4.05%. - Log-loss: for both deeper labels the one-sided lower
95% limit of the difference was above zero. Under the rule this was also a reason to stop. - Consequence: stop after stage
1. - Without the minimum spread: even with the observed standard error alone, the contrast would be only
−0.95times (40,000) and−1.49times (20,000) its standard error. The measured contrasts are more than an order of magnitude smaller than the reference effect of the planning.
What the measurement does not show
- Truth: E and M measure closeness to a deeper search of the same engine. Blind spots that the label search, the network and the reference share are invisible to this measure.
- Playing strength: none of the measures is a comparison in games.
- Deeper data generation: stage
1only relabelled afterwards. Whether data generation that already searches deeper while playing yields more instructive positions and more accurate game results has not been measured. - Recipe: the finding applies to networks of width
768with a fixed recipe (16epochs, result weight0.1, learning rate0.00025, batch size4,096,300,000games), measured at the final state after the last epoch.
How this was checked
- Sources: the data package of the series with tables, methodology, uncertainties and a source list that backs every number with file and checksum.
- Package check: the package's checking script re-reads every number from its source and checks the prohibitions. For this post it ran again:
6,149checks, all passed. - Recalculation: the table rows of this post are generated by a script of our own from the package data and checked against both language versions. Slopes, contrasts from the per-seed values, costs and the reference effect were recalculated.
- Independent review: an agent of another model family checked text, tables and figures in
2rounds against the data package and its primary sources and recalculated slopes, costs, planning values, power and the limits of stage1itself. It confirmed all table values and identified corrections, among them the origin of the power, the scope of the acceptance test and the naming of the reference values; they have been worked in.