Label depth, data volume and network error: what was measured
Listen to this post12 min
Created by AI from the text of this post and read by the synthetic voice “Sulafat”; not a word-for-word version, and it may contain errors.
Loading…
Created by AI from the text of this post and read by the synthetic voice “Sulafat”; not a word-for-word version, and it may contain errors.Position and speed stay in this browser and are sent nowhere.
The recording could not be played. Open the audio file
Coherent evaluates positions with a neural network. It learns from positions of the project's own games, whose evaluation, the label, comes from a search of the engine. Two quantities can be adjusted: how deep each label search goes, and how much data the network sees. This post collects measurements from 25 and 26 October 2026 on both. It was written at the operator's request and makes no statement about playing strength: the error measures E and M are distances to a deep reference search of the project's own, the log-loss is the prediction error against the game result; none of them is Elo Strength difference to the opponent, estimated from the games, with a 95-percent half-width where the oracle reported one. Never an absolute rating..
The measures
- Label: the evaluation of a training position by a search with
knodes. The project's own data generation labels with 5,000 nodes per move. Its tool arrived on 2026-09-13 with 5,000 nodes as example and acceptance value; stage A replayed the project's own deliveries with 5,000 nodes, and the replayed rows were bit-identical. - Reference: a search of the project's own with 5.12 million nodes per position.
- Label error E(k): the mean of
(σ(label/205) − σ(reference/205))². σ is the logistic function; it turns an evaluation in centipawns into a value between 0 and 1. "Warm" means: the search runs as in data generation; the earlier searches of the same game have filled the search cache, which is kept between moves. - Network error M: the same measure for a network's evaluation, on a frozen measurement set of 92,314 positions from 48,807 games.
- Log contrast: 100 times the difference of the natural logarithms of two values, given in %. For small differences it is roughly the percentage change, for large ones it is not: a log contrast of −37.4 % is a change of −31.2 %.
- Log-loss: how well an evaluation, converted into a probability with a fitted scale, predicts the result of the game. Measured in nats; smaller is better.
Stage A: how accurate is a label?
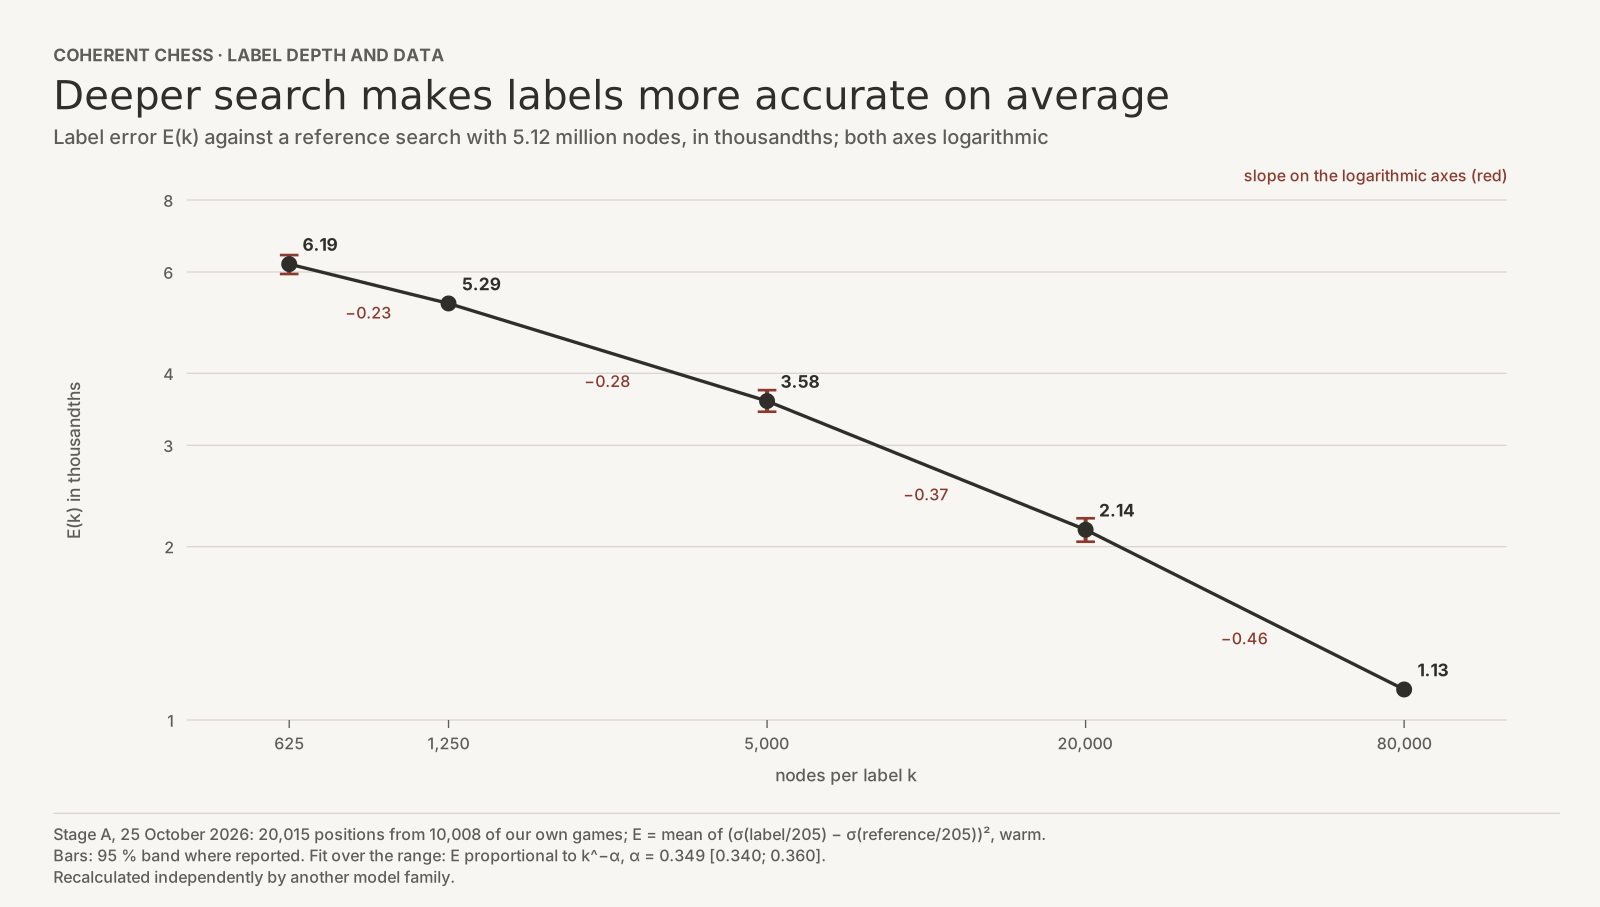
For stage A, 20,015 positions from 10,008 of the project's own games were evaluated again with different node counts and compared with the reference.
| Nodes per label | E(k) | 95 % band |
|---|---|---|
| 625 | 0.00619 | 0.00595 to 0.00642 |
| 1,250 | 0.00529 | – |
| 5,000 | 0.00358 | 0.00343 to 0.00374 |
| 20,000 | 0.00214 | 0.00204 to 0.00224 |
| 80,000 | 0.00113 | – |
- Over the whole range, E proportional to
k^−αfits, with α = 0.349 and a band from 0.340 to 0.360. - On two logarithmic axes the curve is not straight: the slope between neighbouring points, the change in ln E per change in ln k, grows in magnitude over the measured intervals, from −0.23 through −0.28 and −0.37 to −0.46. The slopes are calculated from the table.
- From 5,000 to 20,000 nodes the label error falls by 40 %.
- Another model family recalculated the evaluation with its own implementation and confirmed it.
Stage 1: does a network learn more from deeper labels?
Stage 1 labelled the same positions from 300,000 of the project's own games three times, with 5,000, 20,000 and 40,000 nodes: 25.2 million rows, of which 20.1 million were training rows. The games themselves stayed the same. On each set a network of the same design was trained, for 16 epochs, with 4 seeds. The share of the game result in the training target was λ = 0.1. The rule for the verdict was fixed before the run.
Deeper labels, same positions: the network error changes by less than 0.5 %. Network error M: 5,000 nodes 10.65, 20,000 nodes 10.6, 40,000 nodes 10.62.
| Labels | M, mean of 4 seeds | Log contrast of M against 5,000 | Standard error, observed | Log-loss against 5,000 |
|---|---|---|---|---|
| 5,000 nodes | 0.010654 | – | – | – |
| 20,000 nodes | 0.010602 | −0.49 % | 0.33 % | +0.0017 nats |
| 40,000 nodes | 0.010622 | −0.31 % | 0.32 % | +0.0023 nats |
- Network error: under the rule, the deciding comparison was 40,000 against 5,000 nodes; 20,000 nodes was evaluated descriptively. The rule sets a floor, fixed in advance, for the spread between seeds. Together with the uncertainty of the measurement set this gave the deciding comparison a standard error of 1.88 % and a one-sided upper 95 % limit of +4.05 %. Verdict under the rule: deeper labels bring this network no demonstrable gain at the same data volume. The observed standard errors (column above) were smaller.
- Log-loss: the networks from deeper labels predict the game result worse, by 0.0017 and 0.0023 nats; the one-sided lower 95 % limits of 0.0015 and 0.0020 are above zero. Under the rule this was also a reason to stop.
- Consequence: stop, no further stage. The evaluation notes that this is no evidence against deeper labels under other conditions, for example when data generation itself searches deeper.
Networks with far more training data
Network error and error of the raw 5,000-node label on the same measurement set. M for networks, E(5,000) for the raw label: Stage 1 networks, 20.1 million rows per epoch 10.65, control networks, 1.79 billion rows per epoch 7.33, network of a newer line, 31.4 billion rows per epoch 6.71, raw label with 5,000 nodes 3.44.
With the same measurement function on the same measurement set, three groups of networks were compared. The network of the newer training line is not the network built into the main version of the engine.
| Networks | Training rows per epoch | Seeds | λ | M |
|---|---|---|---|---|
| stage 1 networks with 5,000-node labels | 20.1 million | 4 | 0.1 | 0.010654 |
| control networks of an earlier experiment | 1.79 billion | 3 | 0.5 | 0.007332 |
| network of a newer training line | 31.4 billion | 1 | 0.5 | 0.006712 |
| Comparison | Log contrast of M | Standard error, paired on the measurement set |
|---|---|---|
| control networks against stage 1 | −37.4 % | 0.6 % |
| newer line against stage 1 | −46.2 % | 0.7 % |
| newer line against control networks | −8.8 % | 0.4 % |
- Between the groups, data volume and λ differ; between the control networks and the newer line, recipe and data source differ as well. The table shows the difference between the networks, not an isolated effect of data volume.
- On this measurement set the raw label with 5,000 nodes has an error of E = 0.00344. The networks are at 3.1, 2.1 and 1.95 times that.
Game result: raw labels and networks
On the hold-out rows of the stage 1 data set, 2,620,777 rows, it was measured how well the raw labels predict the game result. The scale for each label depth was fitted on 249,845 rows, and the log-loss measured on the remaining 2,370,932. The uncertainty comes from a bootstrap with 2,000 draws. Because the game numbers do not carry the seed of the data generation, it draws groups of games with the same number instead of individual games: 173 groups for the scale and 1,681 for the measurement.
| Predictor | Log-loss | Difference to the 5,000-node label | Standard error |
|---|---|---|---|
| raw label, 5,000 nodes | 0.3681 | – | – |
| raw label, 20,000 nodes | – | −0.00168 | 0.00012 |
| raw label, 40,000 nodes | – | −0.00208 | 0.00015 |
- On these rows the deeper labels, raw, predict the result of the games played with 5,000 nodes better.
- On a different hold-out set, that of the stage 1 network evaluation, the raw 5,000-node label has a log-loss of 0.3591. The networks trained from it are 0.0435 nats above that on average over the 4 seeds, with a standard error of 0.0007. This comparison is paired: label and networks were measured on the same rows with the same bootstrap draws.
- The depth comparisons of the raw labels in the table and the network comparisons from stage 1 come from different samples.
What is open
- Why the networks from deeper labels predict the game result worse has not been explained.
- An isolated effect of data volume has not been measured; the networks with more data also differ in λ, recipe and data source.
- Stage 1 only relabelled. How labels act when data generation itself searches deeper has not been measured.
How this was checked
- Sources: the evaluations of stages A and 1 with their pre-registered rules, the independent recalculation of stage A, the diagnostic calculations for the network comparisons and for the log-loss of the raw labels, the data generation tool.
- Recalculation: the measured values in this post are held in a checking script and were checked there against the stored evaluations; means, contrasts and ratios were recalculated. Training volumes, seed counts and λ of the comparison networks come from the figures of the diagnosis and were not recounted. Before this post, another model family reproduced the network comparisons from per-game sums including the bootstrap, and recalculated the log-loss differences of the raw labels from stored log-loss values; their standard errors and that of the additional comparison only against stored aggregates.
- Independent review: an agent of another model family checked text, tables and figures in 2 rounds against the same sources and recalculated means, contrasts, slopes, rule limits and ratios itself. It confirmed the recalculated values at their stated precision and identified corrections, among them the number of bootstrap groups, terms, chart titles and the description of the rule; they have been worked in.