Audit of the measurement chain – status 2026-10-25
Listen to this post21 min
Created by AI from the text of this post and read by the synthetic voice “Sulafat”; not a word-for-word version, and it may contain errors.
Loading…
Created by AI from the text of this post and read by the synthetic voice “Sulafat”; not a word-for-word version, and it may contain errors.Position and speed stay in this browser and are sent nowhere.
The recording could not be played. Open the audio file
Every change to Coherent passes a chain of tests before it is adopted. On 2026-10-25 the operator had this measurement chain examined: does it work efficiently, and is it tuned right, neither too tight nor too loose, proven or refuted mathematically where possible, with tolerances and probabilities? The project's review role gave the question to models of three different vendors, which calculated independently, and fixed its own calculation beforehand. For this post the core calculation was redone once more, independently, and every count was checked against the daily sheets of the pipeline and the oracle register.
Note: prebuilding successors, the most important lever from this audit, is currently being examined.
The result in brief
- Not too loose. On the regular gain path, a candidate without a real gain is promoted with about
3in100,000, calculated numerically in the model. Five independent calculations agree on this. Proven in the Gaussian model is a strict upper bound of12in100,000, without approximating the check points. - Tight for small real gains. Calculated numerically in the model: a gain of
+2nElo Normalised Elo: the Elo difference divided by the spread of the game results, so that the SPRT bounds mean the same at different time controls. is promoted with0.5%,+5nElo with26%,+8nElo with80%. - Whether the setting is exactly right cannot be proven. How close it lies to the optimum depends on the unknown distribution of real effects and on assumptions about capacity; the audit's calculations give different answers under different assumptions.
- The counted idle time shows a substantial loss in operation. From
2026-09-29to2026-10-24the oracle stood idle28.7% of the time, in the last week31.8%. The target is below10%. Mostly, the next candidate was missing after a pass. - Under simplifying assumptions the counts fit roughly half transfer: about half of the effect measured at fixed nodes would arrive at the clock. Then the bounds of triage and oracle fit together.
The measurement chain
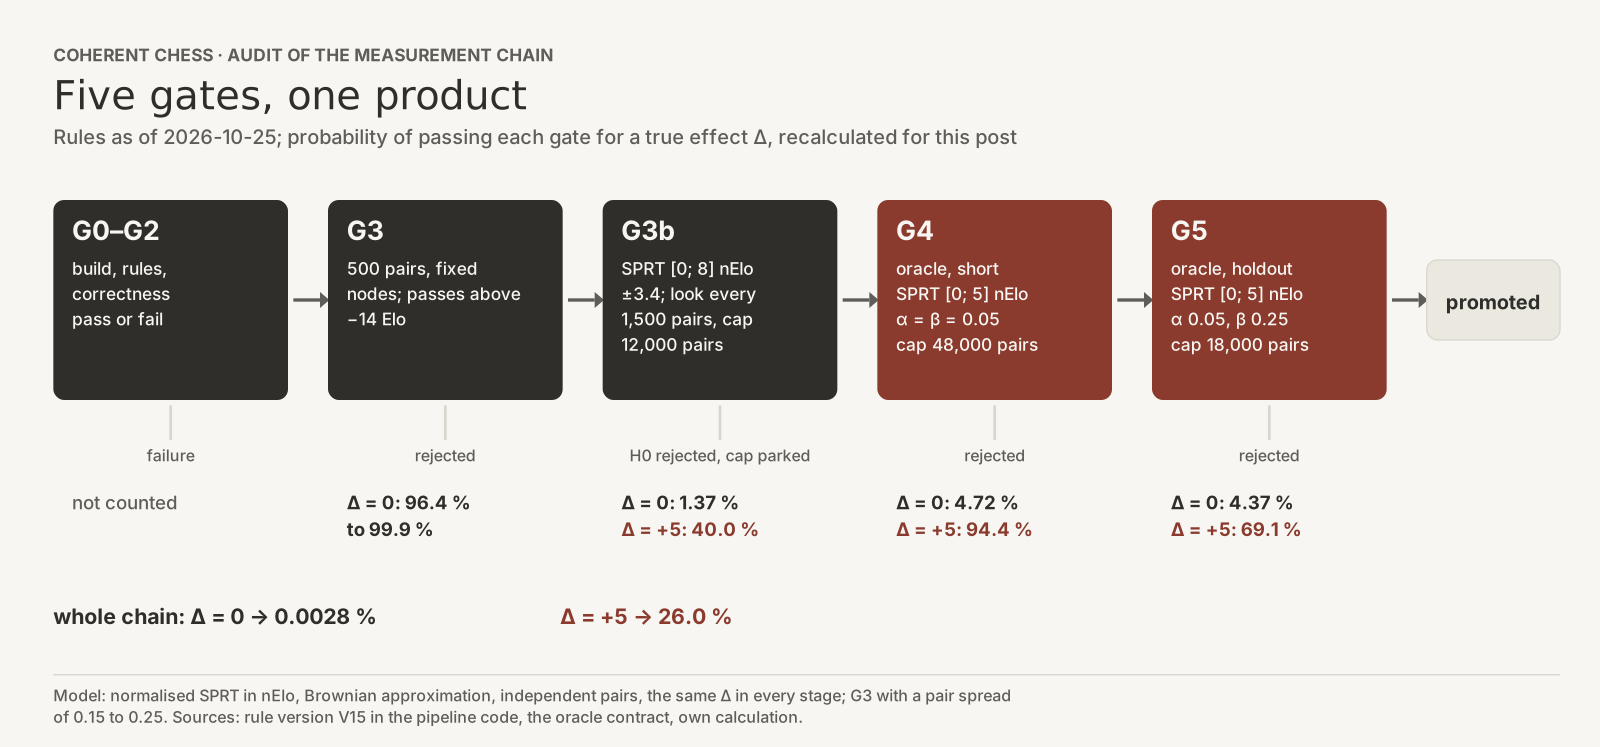
G0toG2are pass or fail: a build without warnings, rules and size limits, correctness of move generation, UCI Universal Chess Interface, the text protocol between a chess engine and the program that runs it. behaviour, games against a random mover without illegal moves, crashes or time losses.G3, the triage, plays500game pairs at fixed nodes. If the score is at−14Elo Strength difference to the opponent, estimated from the games, with a 95-percent half-width where the oracle reported one. Never an absolute rating. or below, the candidate is rejected.G3bis a sequential test at fixed nodes:[0; 8]nElo with bounds±3.4, a look every1,500pairs, a cap at12,000pairs. A candidate that reaches the cap without a decision is parked; that is not a pass.G4is the oracle's short stage: SPRT Sequential probability ratio test. Games are played until the accumulated evidence reaches one of two bounds; then the test stops.[0; 5]nElo,α = β = 0.05, at most96,000games.G5is the oracle's holdout stage on a segment of its own: SPRT[0; 5]nElo,α = 0.05,β = 0.25, at most36,000games. Its conditions are not published.
If an oracle test reaches its game limit without a decision, that is undecided and not a pass. nElo is normalised Elo: the effect divided by the spread of the pair results, so that the bounds mean the same at different time controls. Candidates that only compute faster and measurements at the clock have paths of their own; there are no separate counts per kind for them.
Model and formulas
All calculations use the same model, so that they can be compared:
- Pairs are independent, and the true effect
Δis the same in every stage. - The test's log-likelihood ratio (LLR Log-likelihood ratio, the running evidence of an SPRT. It starts at 0; a stage passes at the upper bound and fails at the lower one.) is approximated as Brownian motion.
- With
t = Δ/(800/ln 10)andδ = elo1/(800/ln 10), each pair adds to the LLR of the test[0; elo1]an increment with meanδ(2t − δ)and variance2δ². - Equivalently: a single pair estimates
Δwith variance(800/ln 10)²/2 ≈ 60,356nElo². - The bounds are
A = ln((1 − β)/α)above andB = ln(β/(1 − α))below. ForG4that is±ln 19 = ±2.944, forG5it isln 15 = 2.708andln(0.25/0.95) = −1.335. - The chain is the product of the stages:
P(promotion | Δ) = P_G3(Δ) · P_G3b(Δ) · P_G4(Δ) · P_G5(Δ). - All probabilities apply to the regular gain path, conditional on passing
G0toG2, without additional selection and without losses from being overtaken.
In the oracle the test is checked here every 20 pairs. If it is checked after every pair, the error rate at Δ = 0 rises from 4.72 to about 4.9 % in G4 and from 4.37 to about 4.5 % in G5. This changes none of the statements.
Each stage on its own
| Stage | passes at Δ = 0 | at Δ = +5 | at Δ = +8 | mean pairs at Δ = 0 | counted |
|---|---|---|---|---|---|
G3 | 96.4 to 99.9 % | 98.8 to 99.97 % | above 99.4 % | 500 | 2026-10-13 to 2026-10-24: 26 of 494 rejected, 5.3 % |
G3b | 1.37 % | 40.0 % | 84.4 % | 7,173 | 2026-10-13 to 2026-10-24: 36 passed, 303 rejected, 55 at the cap |
G4 | 4.72 % | 94.4 % | 99.9 % | 13,023 | since 2026-09-24: 46 passed, 34 rejected, none at the game limit |
G5 | 4.37 % | 69.1 % | 94.8 % | 5,505 | since 2026-10-21: 3 of 3 passed |
The values for G3 depend on the spread of the pair results; the range holds for a spread of 0.15 to 0.25. The threshold of −14 Elo then corresponds to −33 to −20 nElo. G3 is thus a cheap damage filter.
G3b is the tightest point for small gains. At Δ = +4 a candidate passes there with only 25.3 %; with 49.4 % it ends at the cap and is parked.
The column “counted” comes from the daily sheets and the oracle register. Up to the state of the audit, G4 stood at 46 of 80; one more rejection followed on 2026-10-25.
The whole chain: five calculations
Each stage lets small gains through only in part; the chain multiplies the shares. Whole chain: promoted: -2 0, -1.5 0, -1 0, -0.5 0, 0 0, +0.5 0.01, +1 0.04, +1.5 0.15, +2 0.47, +2.5 1.26, +3 2.95, +3.5 6.04, +4 10.92, +4.5 17.67, +5 26.04, +5.5 35.53, +6 45.53, +6.5 55.42, +7 64.67, +7.5 72.88, +8 79.82, +8.5 85.43, +9 89.77, +9.5 93, +10 95.32, +10.5 96.91, +11 97.98, +11.5 98.68, +12 99.13; G3b passes (H1): -2 0.2, -1.5 0.33, -1 0.54, -0.5 0.86, 0 1.37, +0.5 2.14, +1 3.27, +1.5 4.91, +2 7.19, +2.5 10.27, +3 14.27, +3.5 19.28, +4 25.32, +4.5 32.29, +5 40.01, +5.5 48.21, +6 56.53, +6.5 64.62, +7 72.13, +7.5 78.79, +8 84.43, +8.5 88.99, +9 92.51, +9.5 95.11, +10 96.93, +10.5 98.15, +11 98.93, +11.5 99.41, +12 99.68; G4 passes (H1): -2 0.45, -1.5 0.82, -1 1.48, -0.5 2.66, 0 4.72, +0.5 8.17, +1 13.69, +1.5 21.83, +2 32.76, +2.5 45.85, +3 59.66, +3.5 72.4, +4 82.65, +4.5 89.89, +5 94.43, +5.5 97.03, +6 98.42, +6.5 99.16, +7 99.54, +7.5 99.75, +8 99.86, +8.5 99.92, +9 99.96, +9.5 99.98, +10 99.99, +10.5 99.99, +11 100, +11.5 100, +12 100; G5 passes (H1): -2 0.63, -1.5 1.05, -1 1.72, -0.5 2.77, 0 4.37, +0.5 6.71, +1 10, +1.5 14.42, +2 20.07, +2.5 26.95, +3 34.87, +3.5 43.51, +4 52.42, +4.5 61.12, +5 69.15, +5.5 76.18, +6 82.03, +6.5 86.69, +7 90.25, +7.5 92.89, +8 94.81, +8.5 96.19, +9 97.18, +9.5 97.9, +10 98.43, +10.5 98.81, +11 99.1, +11.5 99.32, +12 99.49.
Δ in nElo | calculation 1 | calculation 2 | calculation 3 | calculation 4 | recalculation here |
|---|---|---|---|---|---|
0 | 0.003 % | 0.0030 % | 0.002 % | 0.003 % | 0.0028 % |
+2 | 0.5 % | 0.48 % | 0.42 % | 0.48 % | 0.47 % |
+4 | 10.7 % | 10.8 % | 10.6 % | 10.8 % | 10.9 % |
+5 | 25.5 % | 25.6 % | 25.8 % | 25.8 % | 26.0 % |
+8 | 78.9 % | 79.0 % | 80.1 % | 79.7 % | 79.8 % |
+10 | 94.7 % | 94.8 % | 95.5 % | 95.4 % | 95.3 % |
- Calculation
1: grid convolution, a closed-form series with a correction for discrete check points and a simulation with the pipeline's real LLR function. - Calculation
2: quadrature,200,000random paths, a simulation with pentanomial Games are played in pairs with swapped colours; the five counts are the pairs scoring 0, ½, 1, 1½ and 2 points. distributions and the real LLR function, plus a direct simulation of the whole chain with2million candidates without gain. It gave59promotions, that is0.00295%. - Calculation
3: dynamic programming over states, an exact Monte Carlo calculation per block and100runs of the real decision function. - Calculation
4: Monte Carlo in the Brownian model, fixed before any of the other deliveries was read. - Recalculation here: grid convolution of the LLR density between the bounds, plus Monte Carlo with
400,000paths per point. At the checked pointsΔ = 0,+4,+5and+8, the two ways differ by at most0.15percentage points.
Calculations 2 and 3 come from models of two other vendors. Calculations 1 and 4 and this recalculation come from the same vendor family.
What is proven, calculated or open
| Statement | Status | Frame |
|---|---|---|
The chain promotes candidates with Δ ≤ 0 with at most about 3 in 100,000. | calculated numerically in the model and checked independently | That Δ = 0 is the worst case is proven (proof 1); the five calculations lie within 0.001 percentage points. |
This rate lies below 12 in 100,000. | proven in the Gaussian model | without approximating check points and caps (proof 2) |
Small gains between 2 and 5 nElo are not promoted in 74 to 99.5 % of cases. | calculated numerically in the model | at full transfer; if transfer is smaller, even more are lost |
| Today's setting is uniquely optimal. | cannot be proven | The distribution of real effects cannot be pinned down from the counts: for the outcomes of 2026-10-18 to 2026-10-24, two distributions with 4.6 and 68 % positive effects both reproduce the rates; on a grid, 64 three-point distributions also passed the check at G3. |
Today's setting lies more than 25 % below the optimum. | neither proven nor refuted in general | One calculation reaches 79 to 93 % of the best calculated point, another finds no alternative that is better in all measures. A third shows counter-examples: with limited farm throughput the setting reaches only 52.1 % of the best variant examined there. The report rates “badly wrong” as refuted. Not recalculated for this post. |
G3 lets small gains through at least 95 % of the time. | only with a limit | This holds only up to a spread of the pair results of 0.274 (proof 3). |
| About half of the effect arrives from triage at the clock. | estimated, under assumptions | 0.5, 0.55 and about 0.5 in three calculations, here 0.51 with interval 0.41 to 0.61 |
| The oracle's idle time comes from operation, not from the setting. | counted | daily sheets 2026-09-29 to 2026-10-24 |
Proof 1, the worst case. Couple two effects Δ₁ < Δ₂ through the same random numbers. The mean increment δ(2t − δ) grows with t, so at every check point the LLR at Δ₂ lies at least as high as at Δ₁. If the path at Δ₁ reaches the upper bound before the lower one, so does the path at Δ₂. So the pass probability of every stage grows with Δ, with looks and caps, and so does the product. For all Δ ≤ 0, Δ = 0 is the worst case.
Proof 2, the strict bound. At Δ = 0, exp(LLR) is a non-negative martingale with expectation 1. By the maximal inequality for non-negative martingales it reaches the height e^A with probability at most e^(−A), no matter when and how often it is checked. For G3b that is e^(−3.4) = 0.0334, for G4 1/19 = 0.0526, for G5 1/15 = 0.0667. With independent stages the product is at most 0.000117, that is 12 in 100,000; G3 can only make it smaller. For 1,000 independent trials with candidates without gain, at least one false promotion is then to be expected with at most about 11.1 %, by the calculated value with about 2.7 %. The bound is proven in the Gaussian model. The oracle estimates the ratio from the games; an error bound for this test with finitely many games is not established here.
Proof 3, the limit of G3. G3 lets a candidate through if the mean pair score lies above 1/(1 + 10^(14/400)) = 0.47986. At Δ just above 0 it averages 0.5 with standard deviation σ/√500. A pass rate of at least 95 % requires √500 · 0.02014/σ ≥ 1.645, that is σ ≤ 0.274. This holds in the normal approximation, not for every distribution of pair results.
Transfer: the counts fit about half
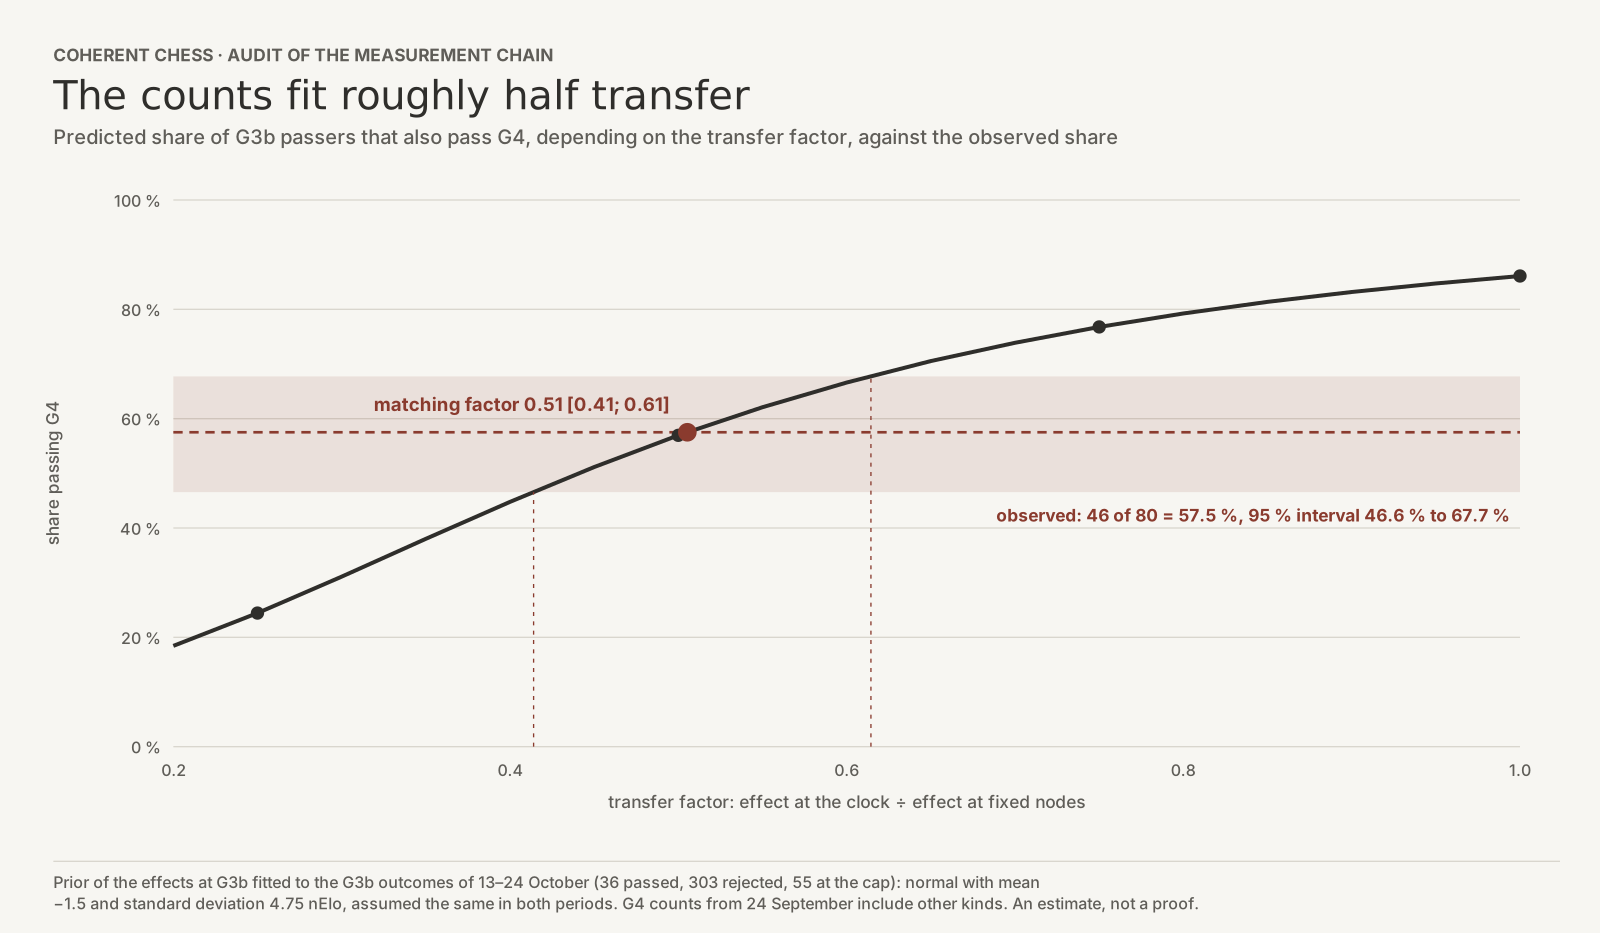
G3 and G3b measure at fixed nodes, the oracle at the clock. How much of an effect arrives at the clock can be estimated from the counts:
- Distribution of effects: on a grid with steps of
0.25nElo, a normal distribution of the effects inG3bwith mean−1.5and standard deviation4.75nElo fits the outcomes of2026-10-13to2026-10-24best. It predicts9.3% passed,76.9% rejected and13.8% at the cap; observed were9.1,76.9and14.0%. - Expectation at full transfer: under this distribution only about
1.3% of theG3bpassers have no gain. If their effect arrived at the clock in full,86.1% of them would have to passG4. - Observation: since
2026-09-24,46of80passed, that is57.5%, with a95% interval from46.6to67.7%. - Result: that fits a factor of
0.51, with the interval0.41to0.61.
If the estimate holds, G3b with [0; 8] at fixed nodes corresponds at the clock to roughly [0; 4]. That fits the oracle with [0; 5]. The estimate has limits:
- It assumes that the effects are distributed alike in both periods and all shrink by the same factor at the clock. The two groups are offset in time and not linked; different cohorts or a changed pool of candidates could explain the numbers just as well.
- The
G4count also contains candidates of other kinds and rule versions. - The distribution is assumed to be normal.
- The interval only covers the random variation of the
80outcomes.
It is an estimate, not a proof.
Where the time goes
The oracle stood idle on 28.7 % of the time, in the last week on 31.8 %. Oracle idle for lack of a candidate: 09-29 16.5, 09-30 73.5, 10-01 17.6, 10-02 36.5, 10-03 19, 10-04 0, 10-05 1.1, 10-06 1.7, 10-07 77.7, 10-08 66.8, 10-09 37.6, 10-10 51.3, 10-11 73.1, 10-12 40.5, 10-13 0, 10-14 0, 10-15 5.1, 10-16 5.3, 10-17 0, 10-18 15.3, 10-19 0.2, 10-20 28.1, 10-21 60.4, 10-22 25.6, 10-23 85.1, 10-24 8.1; Target: below 10 %: 09-29 10, 09-30 10, 10-01 10, 10-02 10, 10-03 10, 10-04 10, 10-05 10, 10-06 10, 10-07 10, 10-08 10, 10-09 10, 10-10 10, 10-11 10, 10-12 10, 10-13 10, 10-14 10, 10-15 10, 10-16 10, 10-17 10, 10-18 10, 10-19 10, 10-20 10, 10-21 10, 10-22 10, 10-23 10, 10-24 10.
- Idle time: from
2026-09-29to2026-10-24the oracle stood idle for lack of a candidate for178.8hours, on average28.7% of the day. In the last week it was31.8%. - Cause:
117.7of these hours,66%, were waiting for a successor after a pass. In the last week all of the idle time was of this kind. - Gap after a pass: in the
7-day windows up to2026-10-23and2026-10-24, its median without a prebuilt successor was268and464minutes. The only case with a prebuilt successor took20minutes. In earlier windows the medians with a prebuilt successor lay between17and56minutes. - What it would take: to get from
31.8% to below10%, at least36.7hours of this waiting per week would have to go.
This is a matter of operation. The bounds and the measurement conditions are not touched by it.
Recommendations
The review report summarises the shared recommendations as follows:
- Operation first: keep two to three successors on the current state prebuilt at all times. The calculations expect from this a factor of
1.15, interval1.0to1.3, up to about a third more measuring time. No measurement condition is touched; the only risk is build time on the farm. This prebuilding is currently being examined. - Leave
G3unchanged. By one of the calculations, a threshold between−25and−8Elo changes the yield by less than3%. - Add counts, all without strength values: cohorts per rule version and kind, the outcome of
G4per kind, oracle-ready candidates that went stale, and service and waiting times. With these, the distribution of effects and the transfer could be determined. - Do not change bounds in a hurry, but only after recommendation
1and with a measured transfer, as a comparison fixed in advance.
Four proposals remained contested:
| Proposal | for | against |
|---|---|---|
G3b stricter, elo1 from 8 to 10, together with β = 0.25 in G4 | about 95 % of the optimum if the oracle is the bottleneck | starves the oracle after every pass while the gap is open |
G3b looser, bound from 3.4 to 2.94 | 3.5 to 6 % more yield per candidate while the oracle stands idle | weakly founded at a transfer of 0.55; 12 % less per oracle pair when the oracle is busy |
compare G3b variants fixed in advance: bound 3.0 or cap 18,000 pairs | saves more gains with shorter triage or with more farm time | without evidence on the distribution of effects and on capacity, none is preferable |
G5 back to β = 0.05 and a limit of 48,000 games | 4 to 6 % more yield per candidate | One calculation finds about 19 % less yield per occupied hour in G5 at +5 nElo; another also rates the return as worse. |
The review role's verdict: if the transfer is about 0.5, G3b is aligned correctly with the oracle, and no change of the bounds is supported. Today the lever lies in operation. The operator decides on measurement conditions; the recommendations are proposals.
The strongest counter-argument
That the chain rarely detects small gains may be exactly right: if small gains transfer poorly to the clock and to other books, are soon overtaken, or bring little next to rare large gains. The counts do not refute this. The short G4 runs rather point to many large effects of both signs; there a strict triage costs little. That is why the report's result reads “fitting to slightly improvable, lever in operation”, not “loosen”.
What remains unknown
- the transfer per kind of change and per book;
- the mixture of kinds and rule versions in all counts;
- the real service, waiting and core times of oracle and farm;
- the spread of the pair results at fixed nodes, which sets the threshold of
G3in nElo; - the error rates of
G0toG2and the yield of the speed threshold.
What this post does not say
- It gives no strength values of individual candidates. The material of the audit contained none.
- The shares of the optimum and the comparison of the alternatives come from the calculations of the audit and were not recalculated here.
- All calculations and proofs hold in the model, not in every measurement. The same
Δin every stage is a favourable assumption: at a transfer of about0.5, the real chances of small gains are even lower. - It gives no details of the holdout stage's conditions.
How this was checked
The basis is the review role's report, the raw answers of the three calculations, the rule versions in the pipeline code, the oracle contract, the oracle register and the 26 daily sheets from 2026-09-29 to 2026-10-24. For this post the stage curves were recalculated on a grid and checked by Monte Carlo at selected points. The chain, the estimate of the transfer and the limit of G3 were derived from them or analytically, and the proofs were carried out in the model. Idle time, gaps and all counts were recounted from the daily sheets and the register. An agent of another model family checked the text against the same sources and recalculated the core numbers independently.