Northstar below two million: stuck pickups, resource gaps, uneven growth
Listen to this post11 min
Created by AI from the text of this post and read by a synthetic voice; not a word-for-word version, and it may contain errors.
Loading…
Created by AI from the text of this post and read by a synthetic voice; not a word-for-word version, and it may contain errors.Position and speed stay in this browser and are sent nowhere.
The recording could not be played. Open the audio file
Northstar is approaching two million residents but has no stable growth path yet. The last checked sample in this report shows about 1.89 million residents on 5 October 2026. In the west, one full crematorium sits beside two with nearly empty buffers, and hearses at one facility were almost stationary when measured.
Population: Selected Checkpoints of the Same World. Values per step in Residents: 07:06 UTC 1,864,772, 07:18 UTC 1,867,609, 10:31 UTC 1,901,649, 11:09 UTC 1,897,685, 11:18 UTC 1,902,122, 11:20 UTC 1,901,673, 12:07 UTC 1,897,948, 12:09 UTC 1,897,247, 12:56 UTC 1,891,253.
Nor can a blanket claim that the building agent has lost its bearings be drawn from these reports alone. What is documented are specific diagnoses, local improvements, rejected building candidates and one reverted expansion. Whether these add up to lasting service capacity and sustainable growth remains open.
Growth in the morning, losses later
The checkpoints come from the same loaded world after a protective reload that morning, which is the reversal of the forestry expansion described below. All points were taken unpaused at speed 1x.
| Time (UTC, 5 October) | Residents |
|---|---|
| 07:06 | 1,864,772 |
| 07:18 | 1,867,609 |
| 10:31 | 1,901,649 |
| 11:09 | 1,897,685 |
| 11:18 | 1,902,122 |
| 11:20 | 1,901,673 |
| 12:07 | 1,897,948 |
| 12:09 | 1,897,247 |
| 12:56 | 1,891,253 |
Over the whole span the population is higher, yet from 11:18 onwards it falls by roughly 11,000. That is why a positive morning and a negative closing reading are both true.
The points are not a gapless daily series and not a pure migration balance. Population change combines births, deaths, arrivals and departures, and the rolling vital and migration statistics have not yet been reconciled with the point differences. How much of the decline stems from deaths, departures or other causes cannot be stated reliably. The older world before the reload is not linked to this series.
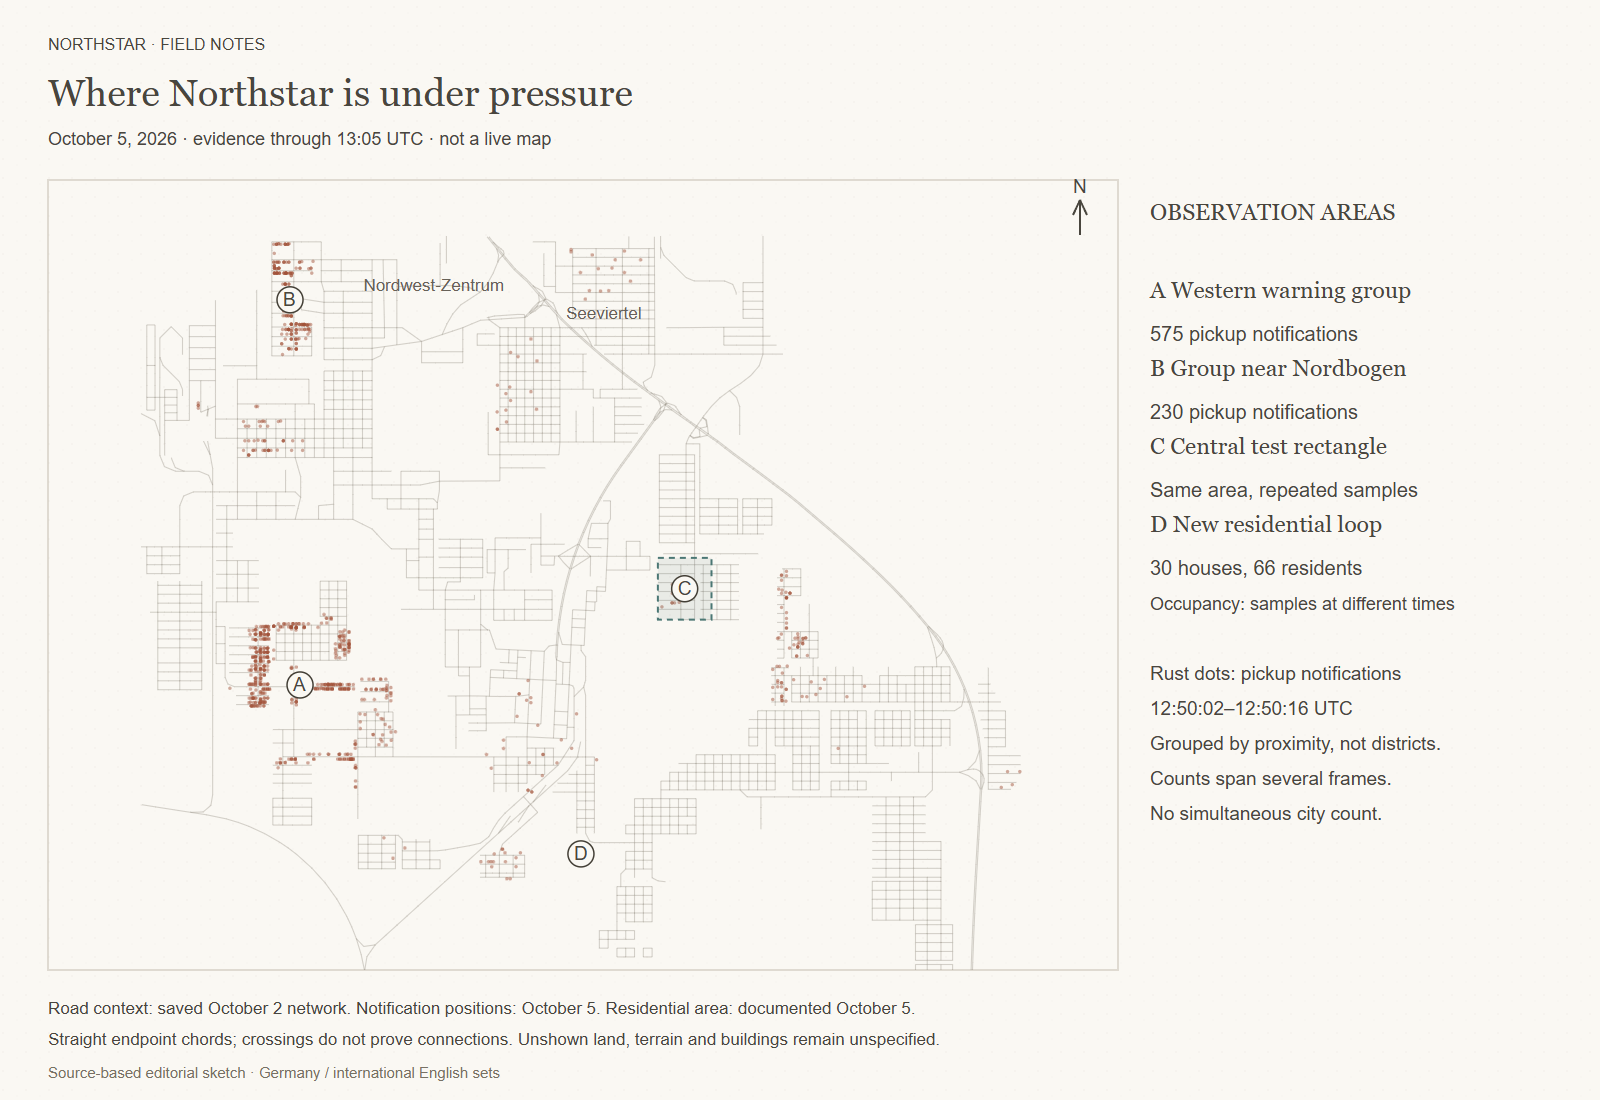
Many reports, but no simultaneous count of all problems
The citywide page sequence at 12:50 UTC contains more than 2,000 distinct report observations, recounted from the eleven original pages.
| Report type | Distinct observations |
|---|---|
| Corpse pickup | 1,014 |
| Missing customers | 309 |
| Missing production inputs | 193 |
| Missing uneducated workers | 128 |
| Ambulances | 65 |
| Full facility | 39 |
| Garbage pickup | 18 |
| Traffic bottleneck | 17 |
This is a survey across several simulation frames, not a snapshot, and the run keeps its status of "partially qualified". A report is neither automatically one building nor one person; several reports can concern the same building.
The two proximity groups with the most corpse-pickup reports lie in the west, with more than 500 reports, and around the north arc. They were formed with a distance criterion between positions, are not administrative areas and are not proven catchment areas of facilities. They indicate where to look first.
Improved in the centre, still blocked in the west
Four complete single-frame samples with the same corpse-pickup filter were taken in the identical central rectangle.
| Time (UTC) | Corpse-pickup reports, central area |
|---|---|
| 10:59 | 57 |
| 12:10 | 29 |
| 12:39 | 14 |
| 12:53 | 5 |
The builder added cooling buffers and regional responsibilities there. The crematorium edited last received more than twice its previous storage, was fully staffed and was assigned to the "central pickup corridor". Pickup targets observed afterwards were indeed in that area. Several changes and the running simulation prevent attributing the decline to the last expansion alone, and the few remaining reports are not a lasting all-clear.
The west is a different case. Three nearby crematoria were read individually at about 12:58 UTC.
| Facility in the west sketch | Buffer occupancy | Staffed positions |
|---|---|---|
| 1 | 45 / 45 | 41 / 41 |
| 2 | 2 / 20 | 25 / 25 |
| 3 | 1 / 45 | 41 / 41 |
Free storage does not coincide with missing staff. For facility 3, the full fleet sample at 13:04 UTC found that around two fifths of the hearses moved at a measured speed close to zero (below 0.2 m/s). That threshold is a description chosen for this sample, not a general intervention limit. The native vehicle class reports all of them as "moving" and would miss the standstill.
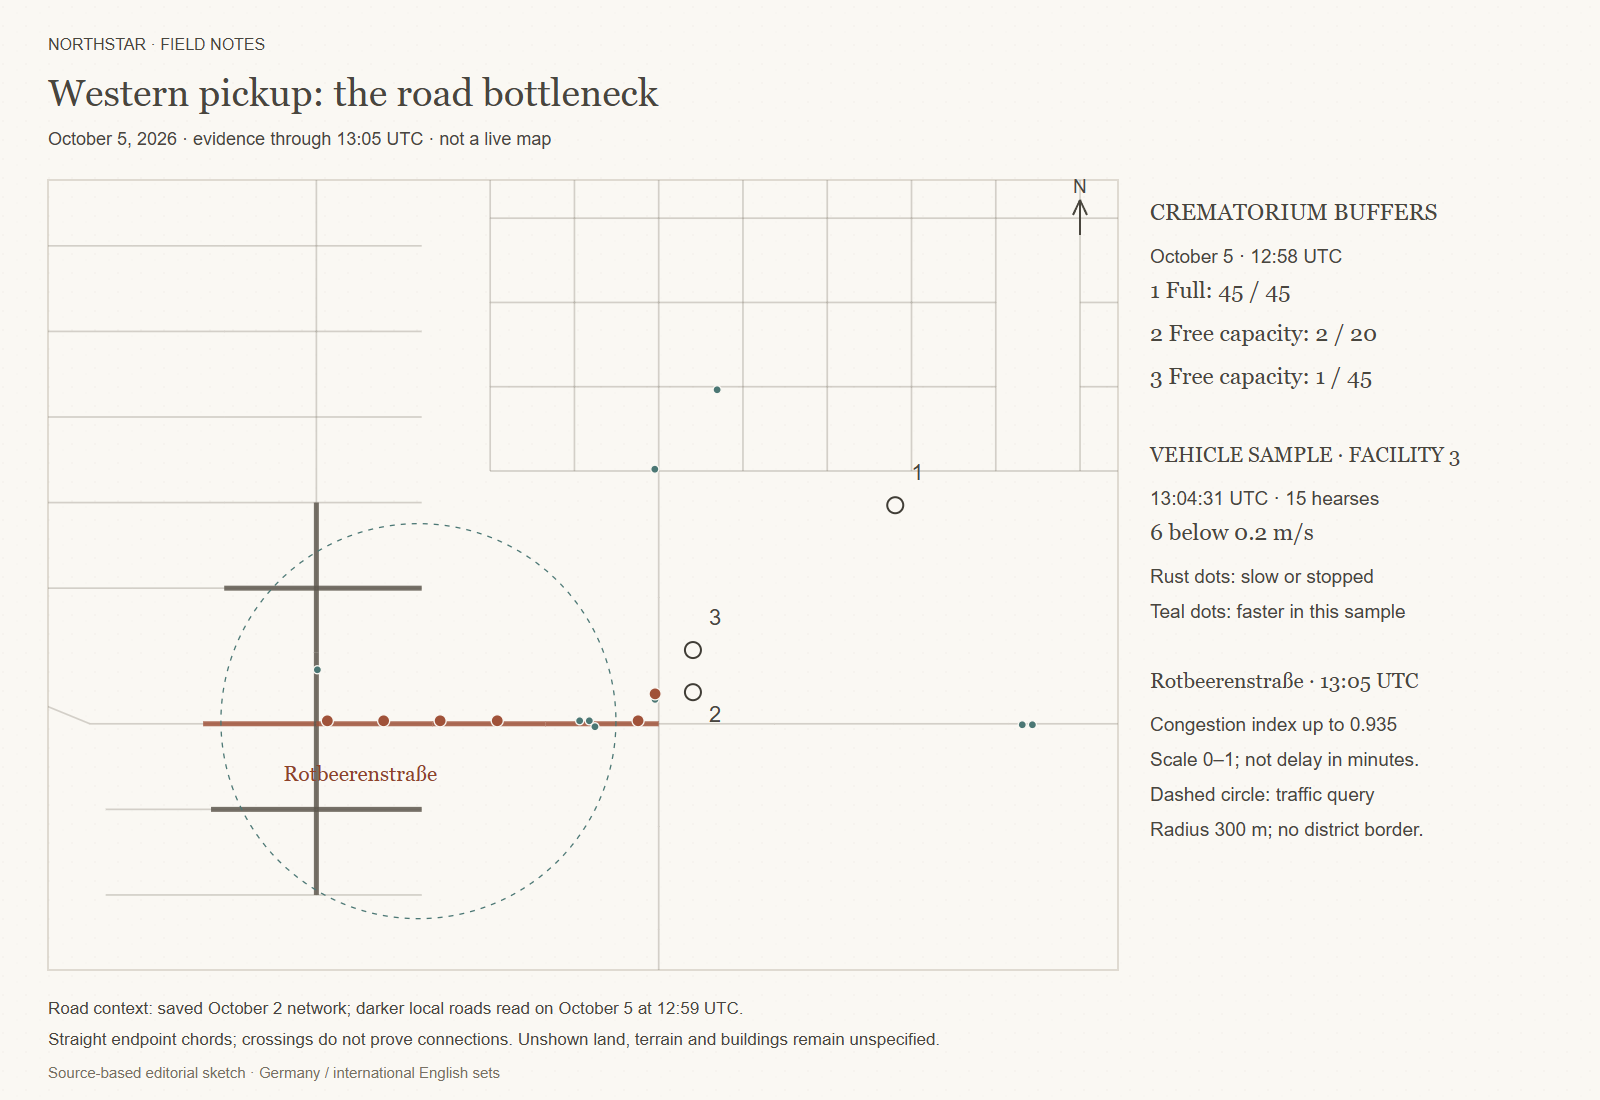
In the local traffic section, a small circle, all evaluated road segments at 13:05 UTC were above the congestion-index threshold used. Candidates that were not road edges or lay outside the area were excluded. On two segments of Rotbeerenstraße the index was about 0.9 on a scale from 0 to 1, where higher means heavier congestion. It is not a waiting time or a share of delayed vehicles. The slow vehicle positions lie mostly along this corridor. A concrete traffic problem is thus documented; whether and how many pickups it prevents, and how much of the population decline it explains, is unknown.
For the builder, priority therefore shifted from additional nominal capacity to actual responsibilities, destinations, routes and arrivals. A free buffer only relieves if jobs are assigned, targets reached, bodies picked up and unloaded.
Resource gaps and unevenly distributed jobs
A complete sample of the five listed resources at 12:00 UTC shows large differences between consumption and local production. Values are native units per game day, smoothed production against consumption.
| Resource | Smoothed production | Consumption | Consumption − production |
|---|---|---|---|
| Grain | 393,863 | 10,087,795 | 9,693,932 |
| Raw timber | 64,191 | 5,024,172 | 4,959,981 |
| Lumber | 4,018,857 | 5,028,816 | 1,009,959 |
| Oil | 0 | 3,857,012 | 3,857,012 |
| Ore | 0 | 2,533,121 | 2,533,121 |
These are production deficits, not measured import volumes or purchase costs. Smoothed oil production is zero while the separate current reading is above zero; the capacity reading is zero. The discrepancy needs clarification, and an actual oil production stop is not documented. For ore, smoothed production, current production and capacity are all zero.
A further survey of warned companies was blocked despite nearly 200 warning assignments read: the first page was slightly over the freshness limit, and another window lost its exact coverage. This is an observation gap, not an all-clear.
Four staffed forestry operations showed only about 66 to 77 percent overall efficiency in stored samples. The builder is therefore looking for richer, cleaner extraction areas. Locally measured pollution is an additional hint, not isolated proof of the cause.
Jobs are unevenly distributed too. At 12:05 UTC, more than 800,000 positions were read, of which about 53,000 were vacant. Most of these vacancies were for well-educated or highly educated workers, but only a handful for the uneducated level.
What the building agent built, rejected and reverted
A new small southern residential loop has 30 completed houses. Occupancy checks were made in two steps: most houses were checked together, the last one afterwards, together giving about 66 residents. This sum is not a simultaneous snapshot. Road, power, water and sewage connections were checked, and the original buildings and networks in the control area were preserved. The net contribution to the city population is not determined, since residents may have moved within Northstar.
Other candidates were deliberately not built. Housing areas near school plots or oil fields lacked complete proof of free plot boundaries, and several southern road variants would have removed existing buildings or had unknown plot consequences.
A forestry expansion in the morning first showed higher production. The following inventory check found a neighbouring industrial building missing. The changed state was discarded and the previously secured save loaded; the 26 original building footprints were present again. The higher yield of the discarded state is not counted as success.
The CPU target is not shown to be met either
The target of more than two million residents at under 30 percent CPU needs a robust throughput comparison. The short sample from 11:03 to 11:05 UTC keeps process and world identity, speed 1x and positive frames together. Over a little more than two real minutes it recorded about 61 percent process CPU, normalised over all logical processors.
This covers the whole game process including rendering, not the simulation jobs alone and not system-wide CPU. It lies well above 30 percent. The window is short and uncontrolled, and the population fell in it. It is no before-and-after proof of an optimisation.
Where things stand
The visible difficulties are operational: growth, pickup, resource extraction and development do not come together everywhere. A full breakdown of the population trend and lasting success of the next western intervention are still outstanding. Open are completed pickup and unloading trips, repeated warning samples in unchanged areas and documented deliveries to strained companies.
Central Inspection Area: Corpse Pickup Alerts. Values per step in Alerts: 10:59 UTC 57, 12:10 UTC 29, 12:39 UTC 14, 12:53 UTC 5.
Local Production Deficits on the Same Statistical Time Base. Values per step in Units/game day: Getreide 9,693,932, Rohholz 4,959,981, Bauholz 1,009,959, Öl 3,857,012, Erz 2,533,121.