Pickup that actually happens: Northstar on 4 October
Listen to this post10 min
Created by AI from the text of this post and read by a synthetic voice; not a word-for-word version, and it may contain errors.
Loading…
Created by AI from the text of this post and read by a synthetic voice; not a word-for-word version, and it may contain errors.Position and speed stay in this browser and are sent nowhere.
The recording could not be played. Open the audio file
Northstar received new waste and burial facilities on 4 October, along with additional grave plots, two regional service areas and productive resource extraction. Population still stayed below two million; the last qualified daily reading was around 1.8 million. The difference that mattered lay between a finished facility and a service that actually receives jobs, drives out and collects something.
Population: Decline in the Measured Period. Residents from the published series, 37 readings from 4 October 2026 to 4 October 2026.
Between the first and the last reading of the day, the population fell by about 52,000. Both endpoints come from the measurement period after the morning recovery, so the difference is neither a full 24-hour balance nor a pure migration balance.
Recovery and operating frame
The game process failed during the night. The saved crash evidence is dated 3 October, 23:53 UTC, which is early 4 October in Berlin. It shows an access violation in a simulation library; memory, hardware or the building agent's own interface are not established as the cause. In the morning the city was restored in the regular way from a previously checked autosave, without an experimental mod change or an edit of the save.
A human operating decision set the frame: further work ran at selected speed 1, under normal game rules, aiming at growth that can be sustained. Population loss was not to count as a route to lower CPU load.
Two similar residential areas, different problems
The building agent compared a burdened residential area with an unremarkable reference area, using equal-sized cut-outs of high-rise housing with similar populations and their actual residential load rather than street images alone.
All residential buildings in both had a confirmed street connection. In the burdened area, about 190 corpse-collection report observations were gathered at 20 different assigned buildings. This multi-part query was not a simultaneous full count. The reference sample, with complete and exact coverage, contained no report.
Local traffic did not give a simple answer either. In its traffic sample the burdened cut-out had the higher flow index and none of its four recorded edges marked as congested; the reference had four of eight. That limits an explanation through general local congestion. Age structure, death rate, the actual assignment of jobs and real pickup travel times remained open.
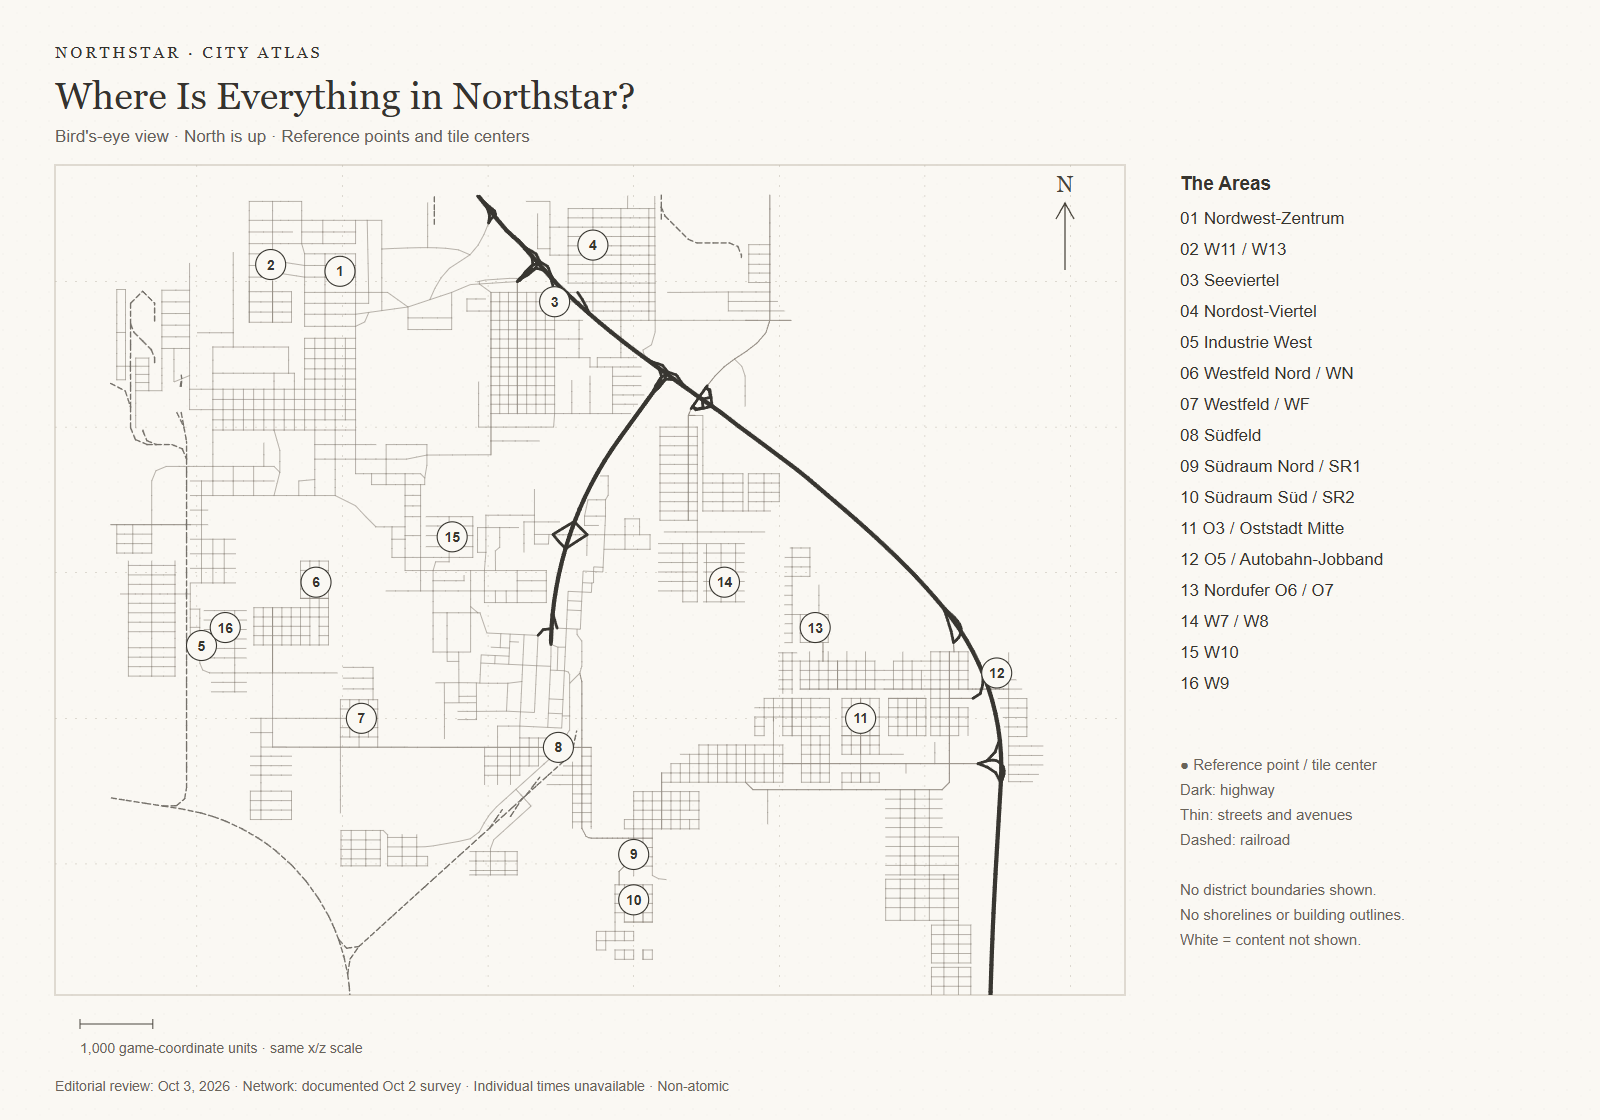
New service areas and real arrivals
Westbogen and Nordbogen were set up as regional service areas. Selected new waste and burial facilities received confirmed assignments, and the existing citywide services stayed in place. An assignment alone proves neither a shorter route nor a successful pickup.
Several new crematoria, two recycling centres, additional cooling rooms and ovens, and new cemeteries were built. In individual facilities, returning transport vehicles and received deceased could be shown. A new cemetery took in deceased, and a second site nearby later showed actual arrivals too. These are concrete operating results, not an all-clear for the whole north. The cemetery that was already working was expanded in two steps; more grave plots add storage reserve but do not show a higher pickup rate.
The counter-case stayed in view. At a reading at 21:32 UTC, a staffed reserve crematorium in the southern Nordbogen had no intake and no deployed vehicles, even after its area assignment was confirmed. Its nominal fleet capacity was ten; a separate complete vehicle sample found four vehicles actually present, all parked. At another processor a considerable backlog existed at the same time. The cause, whether job assignment or reachability, was not established.
Waste collection: measured progress, with limits
A western recycling centre received an additional vehicle depot, and a follow-up sample confirmed a new vehicle on an actual collection trip. A short link between existing road nodes was also built; whether it shortened actual collection routes was open.
Four complete city samples with identical filters counted these waste reports:
| Reading (UTC) | Waste reports |
|---|---|
| 14:37 | 54 |
| 14:51 | 46 |
| 15:00 | 39 |
| 15:29 | 26 |
Each figure comes from a single simulation-frame sample and counts reports, not tonnes or affected residents. The decline came after several measures and is no isolated proof that the depot or the road worked.
Later saved queries returned zero hits, but they used a different filter name whose equivalence was not independently qualified. They are therefore neither additional points in this comparison nor a citywide all-clear.
Resources: productive extraction, high purchase costs
Own extraction was expanded through the complete native workflow. A forestry placeholder that was only created initially had no documented productive company and was removed again. Only a finished hub with a closed extraction area, a staffed company and confirmed production counted as new extraction. An existing forest area was enlarged, a second productive site built and a ruined ore extraction company restored. The construction records give dated production displays, not demonstrated deliveries to the affected buyers.
The controlled buyer cohort still showed timber stocks alongside high purchase costs. Three warned processors were above the examined in-game cost threshold of five; one company without a warning was below it. A warning about missing production inputs must therefore not automatically be read as empty timber stock. Nor does a last trade partner prove a timber purchase: a checked reference record concerned an export of the processed product, so a logistics measure based on it alone would have rested on a wrong conclusion.
Housing, economy and data limits
The residential tax was lowered in the regular way for the education levels of the residential zone and read back afterwards. An effect on arrivals or population was not established. Two small free areas received low-density housing; the second batch showed occupied houses. These figures describe the new buildings, not a net gain for the whole city.
The running city balance stayed positive in the late budget samples. That answers a different question from the monetary trade balance: revenue minus city expenses is not the money balance of goods imports and exports, and the latter remained unknown.
| Measure | Early reading | Late reading | Note |
|---|---|---|---|
| Residents | 1,855,778, 2026-10-04 07:09 UTC | 1,803,938, 2026-10-04 21:37 UTC | Not an exact midnight balance |
| Actual jobs | 773,137, 2026-10-04 09:59 UTC | 795,465, 2026-10-04 21:37 UTC | Measured jobs, not zoned cells |
| Unemployment rate | 11.1%, 2026-10-04 09:59 UTC | 13.25%, 2026-10-04 21:37 UTC | Percent; not present at every population point |
| City treasury | 2,000,000,000, 2026-10-04 07:09 UTC | 2,000,000,000, 2026-10-04 21:37 UTC | Game money; money balance of goods trade unknown |
The performance series holds many raw readings with documented gaps including the day edges. None is marked as paused. It contains more than one process and world identifier, but that is not a reliable count of restarts. A lower CPU value after a crash, loading phase, speed reduction or population decline is not an efficiency gain; comparable differences must lie within the same process, world, speed and pause conditions.
The diagnostic tools were checked too. An initially incomplete warning-page collection was blocked rather than replaced by an old or empty summary; after the collection was repaired, a complete page chain with fresh company evidence succeeded. The resulting resource finding remained a sample assembled over several frames, and it is no evidence that the game problems are fixed.
The population series begins after the morning recovery. Missing values stay unknown and readings are not interpolated; after the last reading at 21:37 UTC, no further qualified population value exists for the day.
The two-million milestone and the more demanding joint population and CPU target are not yet accepted. Still open: the unused reserve has to take over actual jobs and pickups, the new extraction sites have to show an effect on matching input deliveries and purchase costs, and the new residential areas need services and jobs that hold up. Project page: CS2.
Labor Market Over the Course of the Day. Unemployment rate (%) and Jobs from the published series, 26 readings from 4 October 2026 to 4 October 2026.
Four Identically Filtered Garbage Checkpoints. Values per step in Alerts: 14:37 UTC 54, 14:51 UTC 46, 15:00 UTC 39, 15:29 UTC 26.